Mexico Map ( D3 & React )
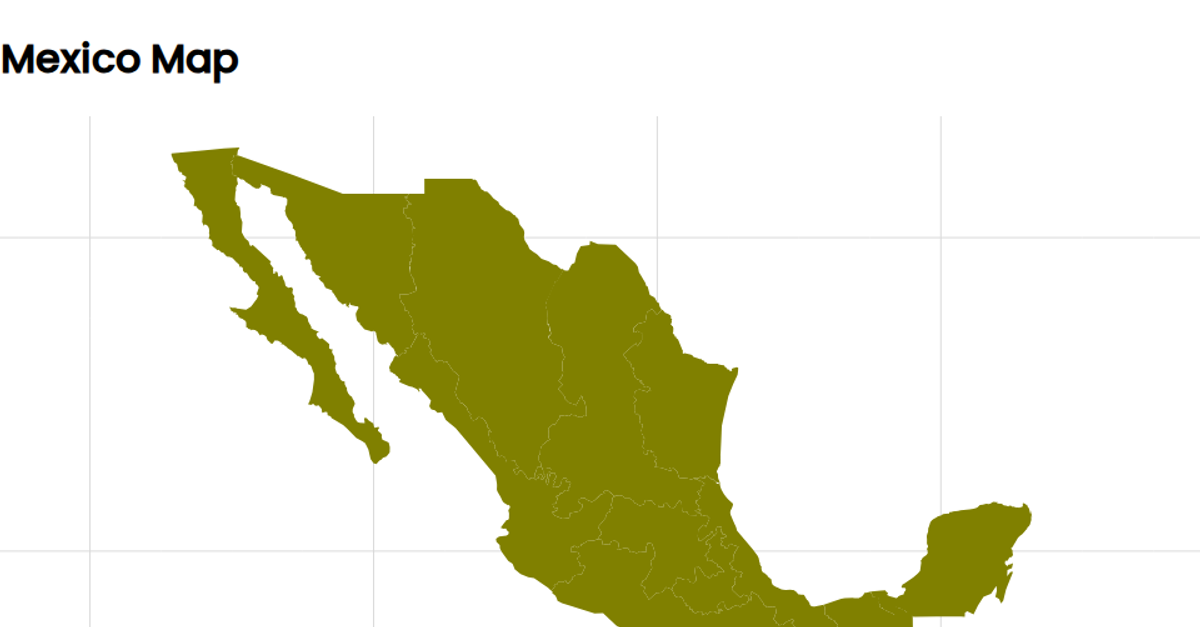
This example displays a map of Mexico with its state boundaries, rendered as SVG paths using a Mercator projection. The visualization loads GeoJSON data from a gist, which was originally sourced from ArcGIS and processed with Mapshaper to extract state polygons. Using D3 v6 within a React component, the code applies `geoMercator` for projection and `geoPath` to generate the path data for each state feature. The map is centered on Mexico using coordinates [-102, 24], and the styling fills the states with a teal color while using light gray strokes for borders, with fonts sourced from Google's Poppins family.
AI-generated descriptionused arcgis.com data for plotting states and boundaries mapshaper.org to create JSON of states witin mexico using mercator projection Still need to center on the rendered image




Comments
Sign in to join the discussion.