🌍 Public
Mexico map
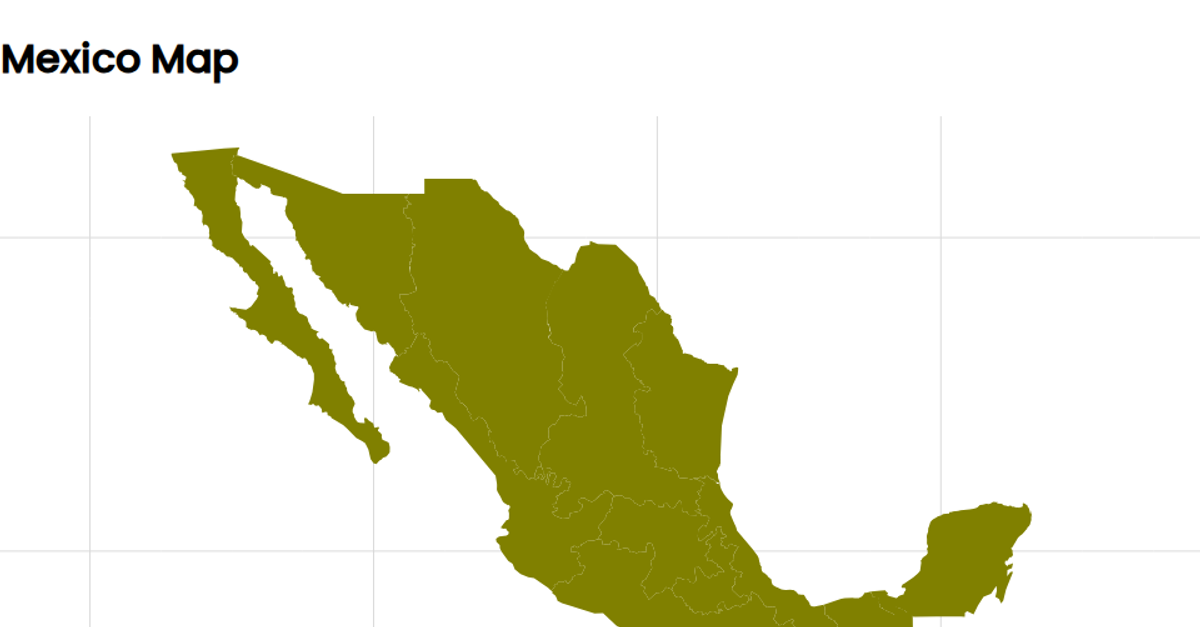
This example displays a choropleth map of Mexico’s regions, rendered as SVG paths. Using D3’s `geoMercator` projection and `geoPath`, it draws country boundaries and graticules, with each region filled in red and outlined in yellow. The map is built with React, fetching TopoJSON data from a gist, converted via `topojson.feature`. The visualization omits data for missing regions, which are not plotted.
AI-generated descriptionused arcgis.com data for plotting states and boundaries mapshaper.org to create JSON of states witin mexico using mercator projection Still need to center on the rendered image
MIT Licensed


Comments
Sign in to join the discussion.