🌍 Public
Mexico Map
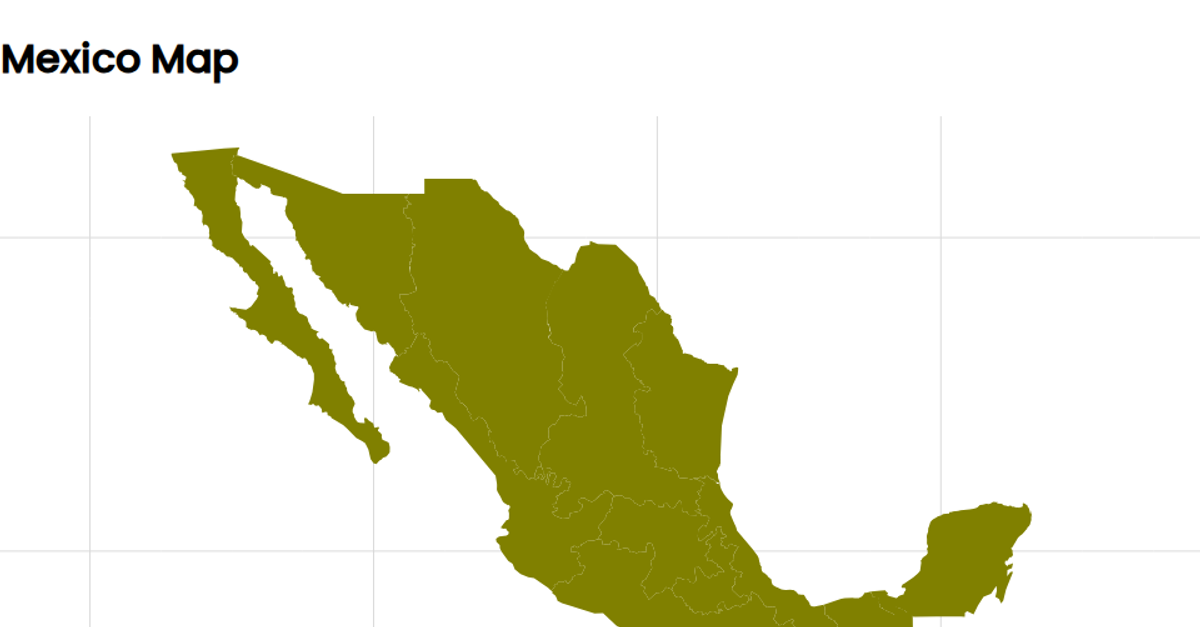
A choropleth-style map of Mexico displays the country's regions as filled polygons, with an overlaid graticule. The visualization uses d3.geoMercator for projection and d3.geoPath to render both the geographic features from a TopoJSON source and the graticule lines. The React-based SVG rendering uses the d3 community module topojson's `feature` function to convert the raw data. The map is styled with CSS, and hovering over a region changes its stroke color, though no tooltip data is shown.
AI-generated descriptionReact Starter code.
MIT Licensed



Comments
Sign in to join the discussion.