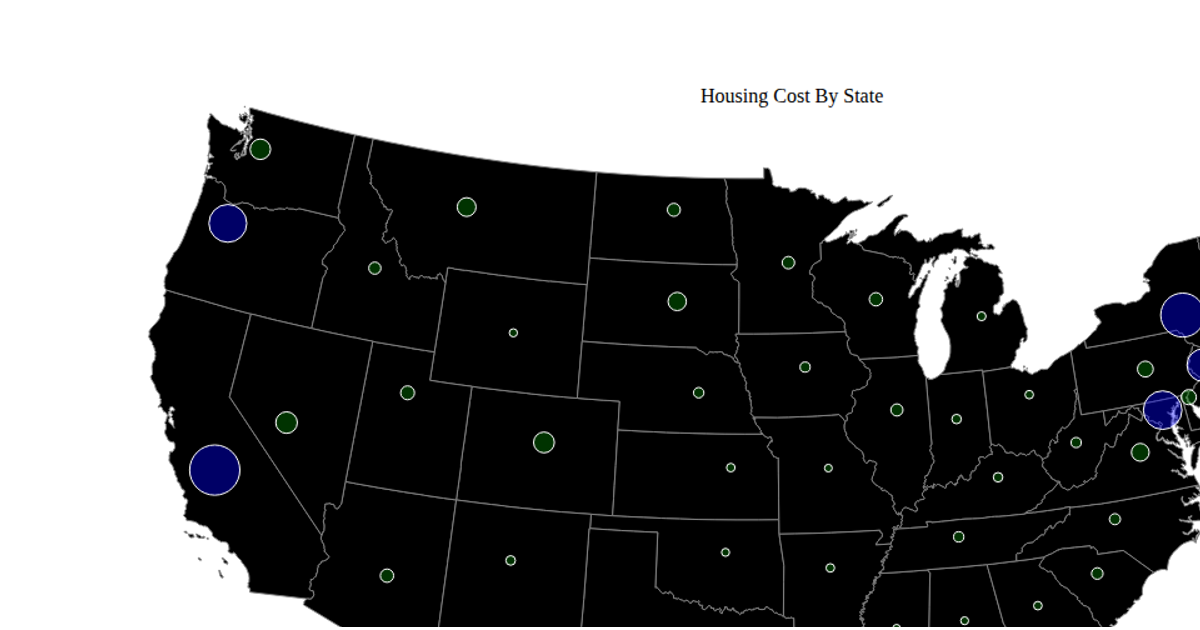
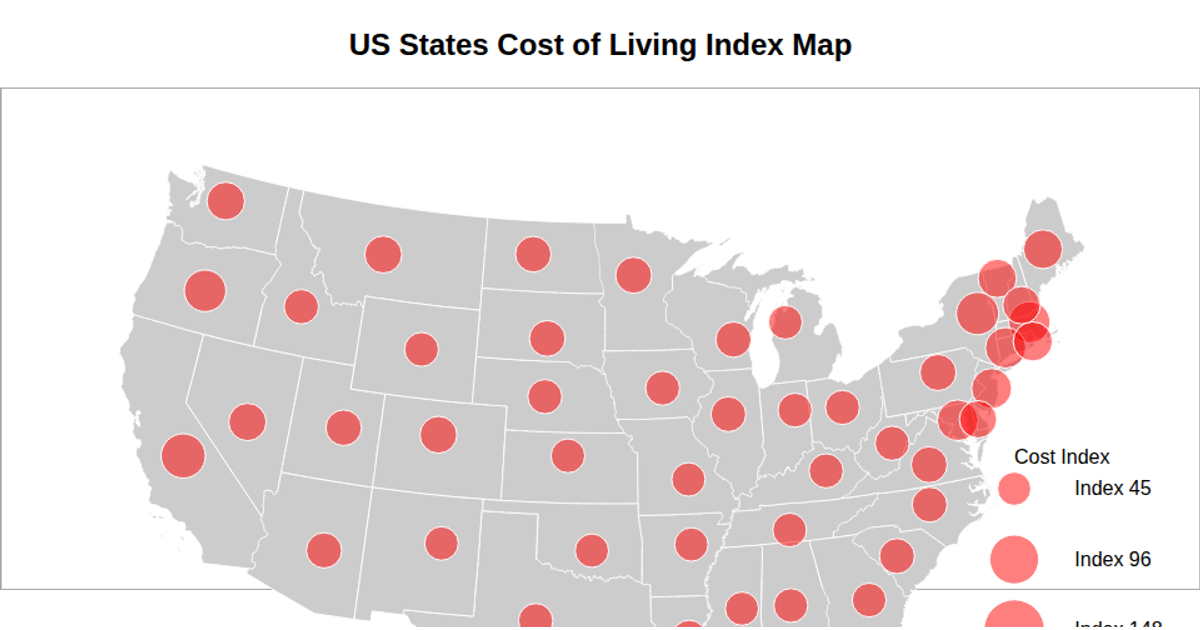
A9 Proportional Symbols Map
This proportional symbols map displays housing cost ranks for U.S. states, with each state's fill color representing its 2022 unemployment rate rank. State boundaries are drawn via `d3.geoPath` using a `d3.geoAlbersUsa` projection, while an `d3.scaleQuantize` color scale maps the rank values to a categorical palette. Hovering a state changes its fill color to a cyan highlight. The map uses unemployment data from the USDA's county-level dataset and state centroids from a CSV file listing latitudes and longitudes.
AI-generated descriptionTooltips are basic hovers. It may take a couple of seconds to load and you have to click on the visualization first
Data is from https://www.ers.usda.gov/data-products/county-level-data-sets/download-data/ and https://inkplant.com/code/state-latitudes-longitudes and https://www.cs.usfca.edu/~apjoshi/cs360/data/expensive-states.csv Used chapter 14 of Scott Murray's Interactive Data Visualization as Reference




Comments
Sign in to join the discussion.