🌍 Public
Proportional Symbols Map - Expensive States
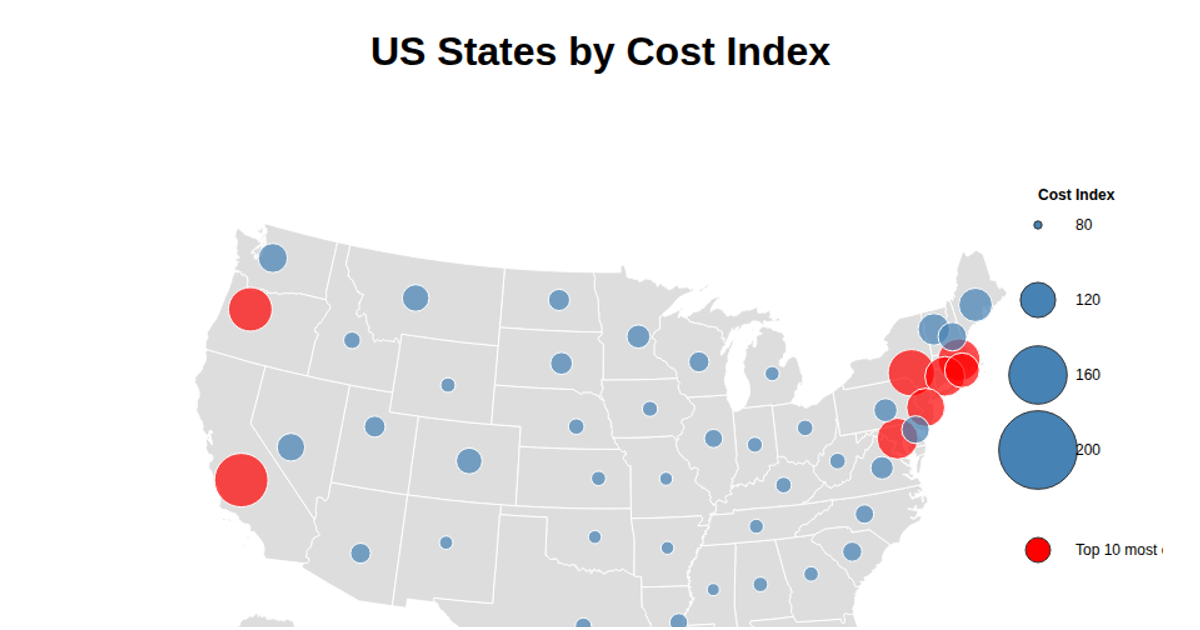
This proportional symbols map displays each U.S. state’s cost-of-living index, with circle size scaled to the numeric index and colored uniformly in blue. It uses D3.js 7.8.5 to load GeoJSON state boundaries, project them with `d3.geoAlbersUsa()`, and render the map as SVG paths via `d3.geoPath()`. A separate GeoJSON file of state centroids feeds the proportional symbols. A legend with four circles communicates the radius-to-value mapping. The visualization emphasizes differences in regional expense, highlighting states like Hawaii and California as the most costly.
AI-generated descriptionProportional Symbols Map for Expensive States.
Reference to https://gist.github.com/mbostock/4342045.
MIT Licensed




Comments
Sign in to join the discussion.