🌍 Public
A9 Proportional Symbols Map
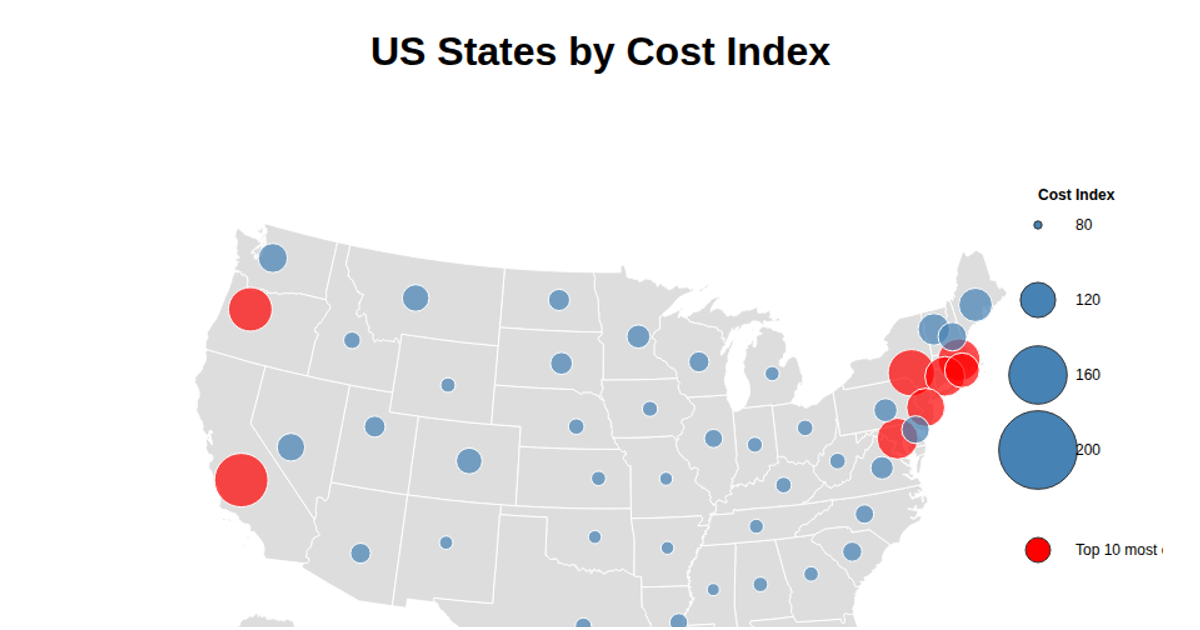
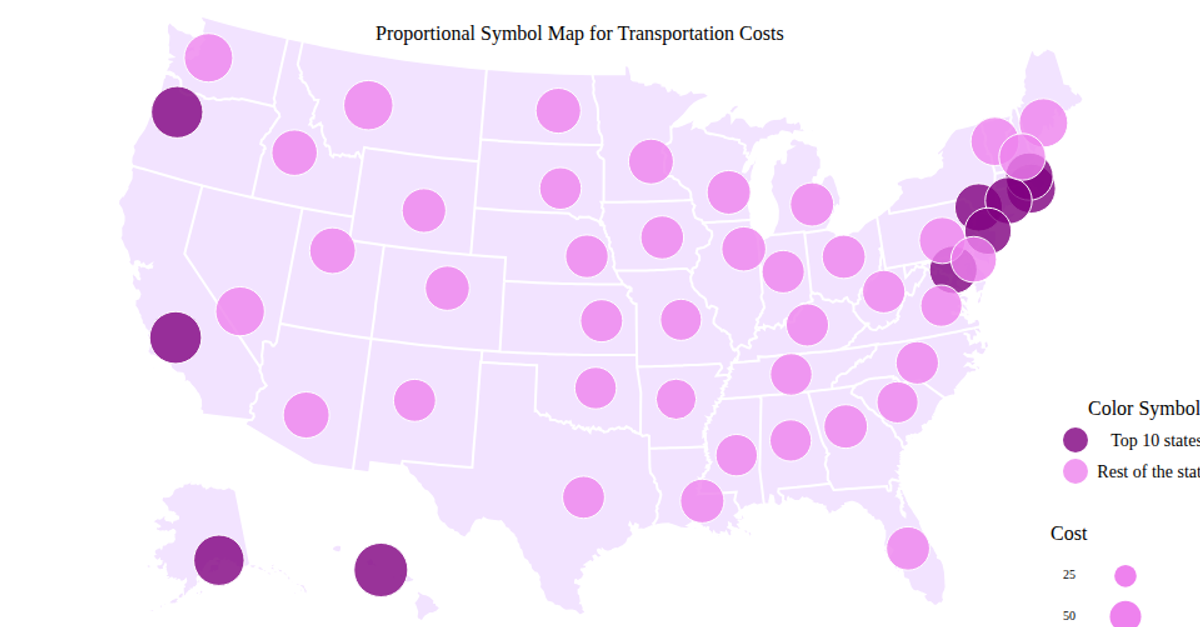
This proportional symbols map displays transportation costs for U.S. states, with circle size scaled by each state’s cost index and red circles highlighting the top ten most expensive states. It renders via D3.js v7 using `d3.geoAlbersUsa`, `d3.geoPath`, and `topojson-client` to draw state boundaries, while `d3.scaleSqrt` maps cost values to circle radii. Hovering reveals a tooltip with the state name and cost. The legend indicates cost ranges, and the underlying CSV data provides geographic coordinates.
AI-generated descriptionMIT Licensed




Comments
Sign in to join the discussion.