A9 - Proportional Symbols Map in D3
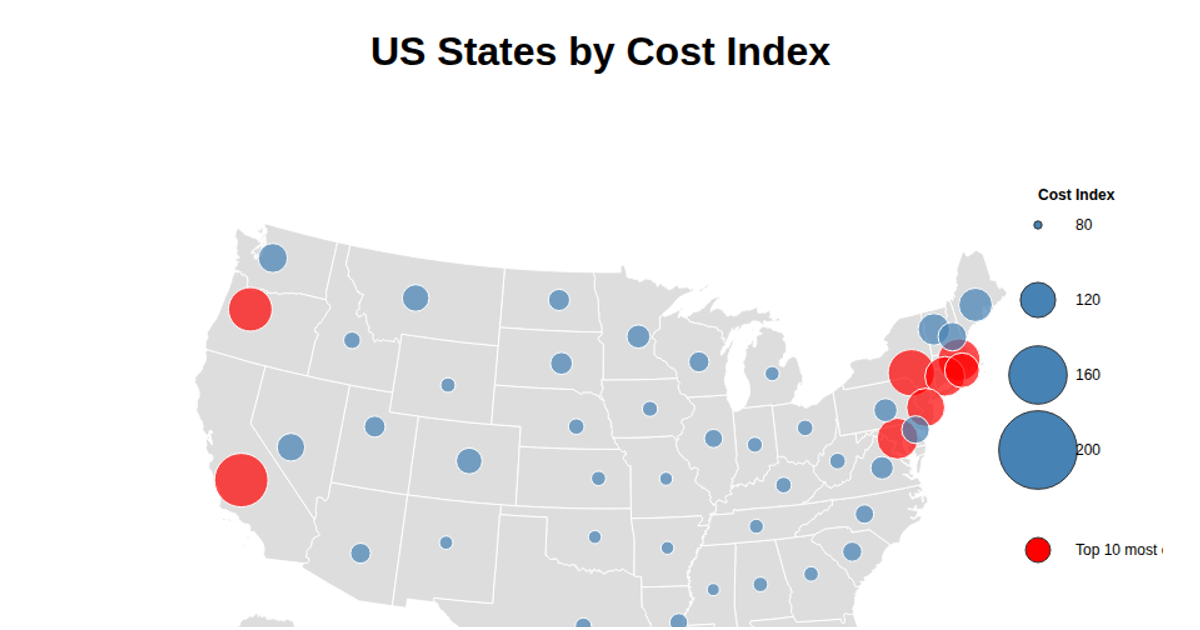
This D3.js proportional symbols map visualizes the cost of living index across US states. Gray states are drawn with the `d3.geoAlbersUsa` projection and `d3.geoPath`, while semi-transparent red circles, sized by a square-root scale, are placed at state coordinates derived from an external latitude/longitude source. A legend displays four bubble sizes with corresponding index values. Hovering over a circle reveals a tooltip with the state name and cost index. Data is loaded via `d3.json` and `d3.csv`.
AI-generated descriptionA proportional symbols map depicting the cost of living index across US States.
Data derived from: https://inkplant.com/code/state-latitudes-longitudes
References:
https://stackoverflow.com/questions/74707350/d3-js-proportional-symbol-map-setting-radius-of-a-circle-based-on-data-value https://observablehq.com/@haileyq0110/proportional-symbol-mapping




Comments
Sign in to join the discussion.