🌍 Public
Choropleth Map Argentina Dptos Corona (Topojson)
Jjeronimoek
Last edited Aug 18, 2020
Created on Aug 18, 2020
Forked from Choropleth Map Argentina Dptos Corona (Topojson)
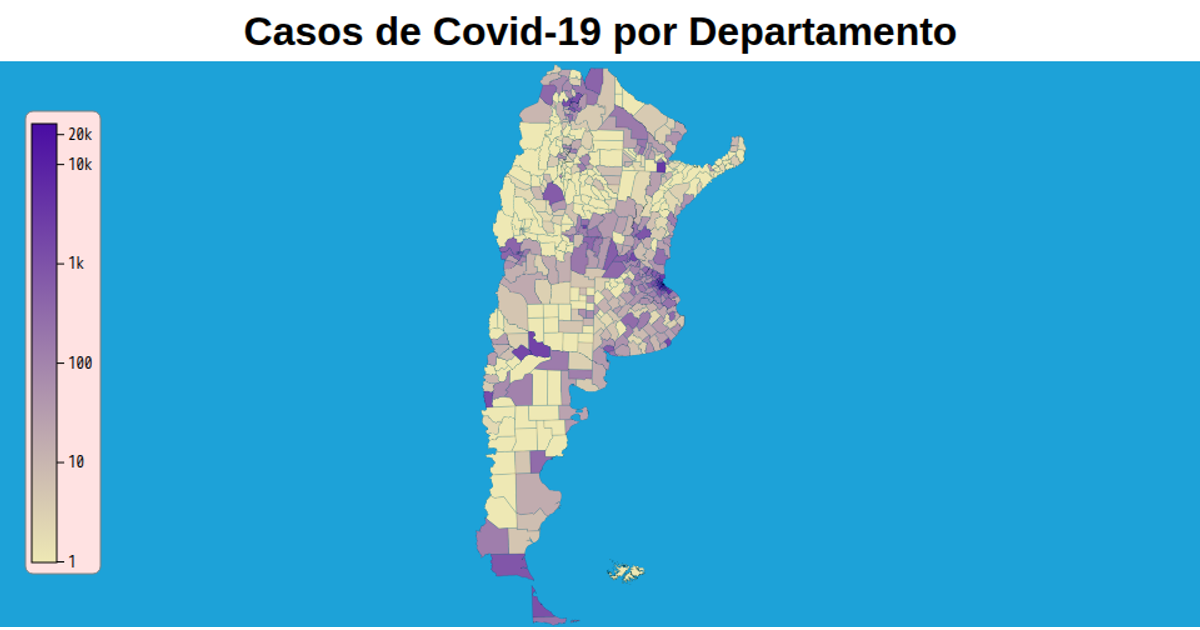
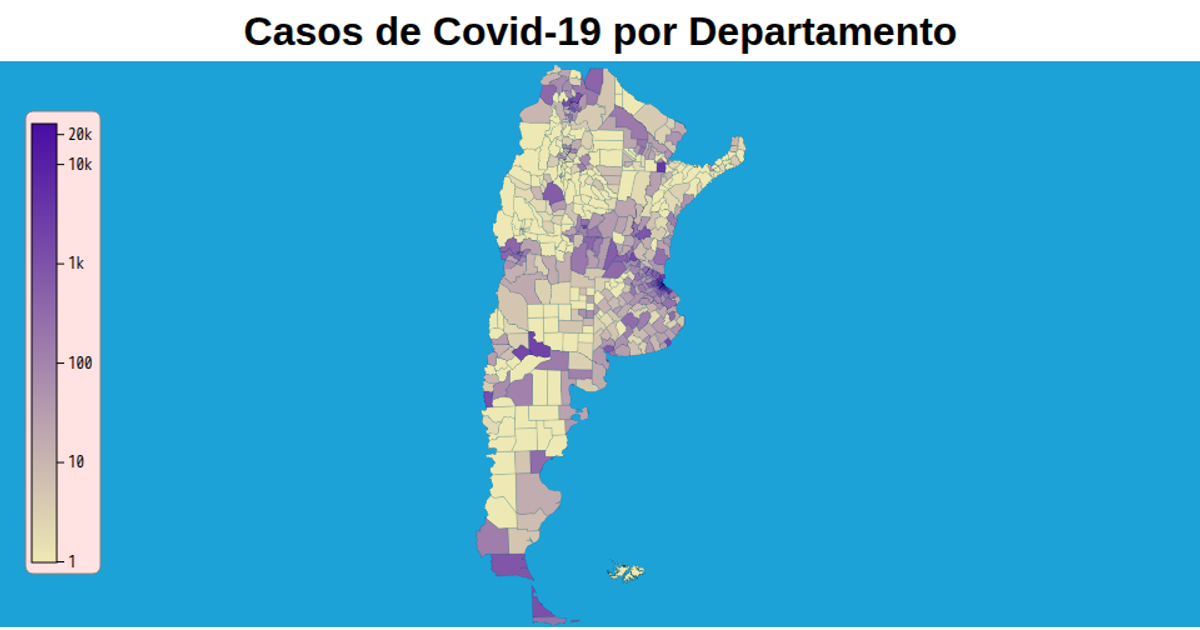
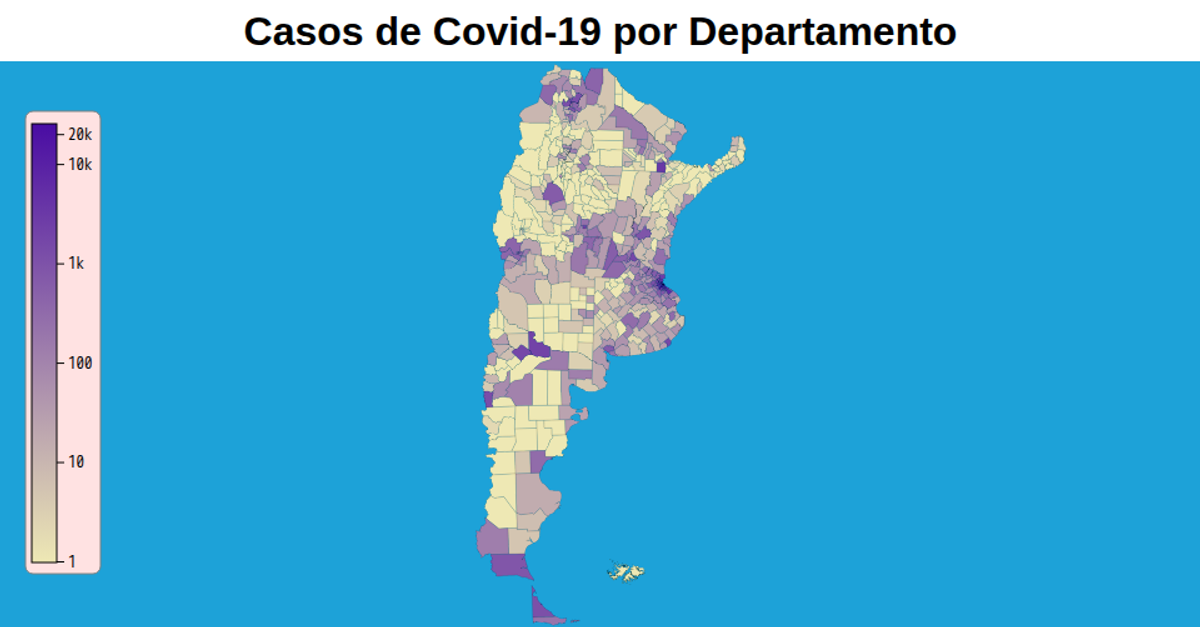
This choropleth map of Argentine departments visualizes COVID-19 data using a TopoJSON format. It renders an SVG graphic with D3 v5, using the `d3.json` function to load and parse the TopoJSON file from a GitHub repository. The map’s color scheme and department boundaries are generated through `d3.geoPath`, while the map's styling is defined in a separate CSS file. The interactive visualization displays the spatial distribution of the data across the country.
AI-generated descriptionMaterias correlativas de la facultad UTN FRCU, carrera INGENIERÍA CIVIL
MIT Licensed



Comments
Sign in to join the discussion.