🌍 Public
Choropleth Map Argentina Dptos Corona (Topojson)
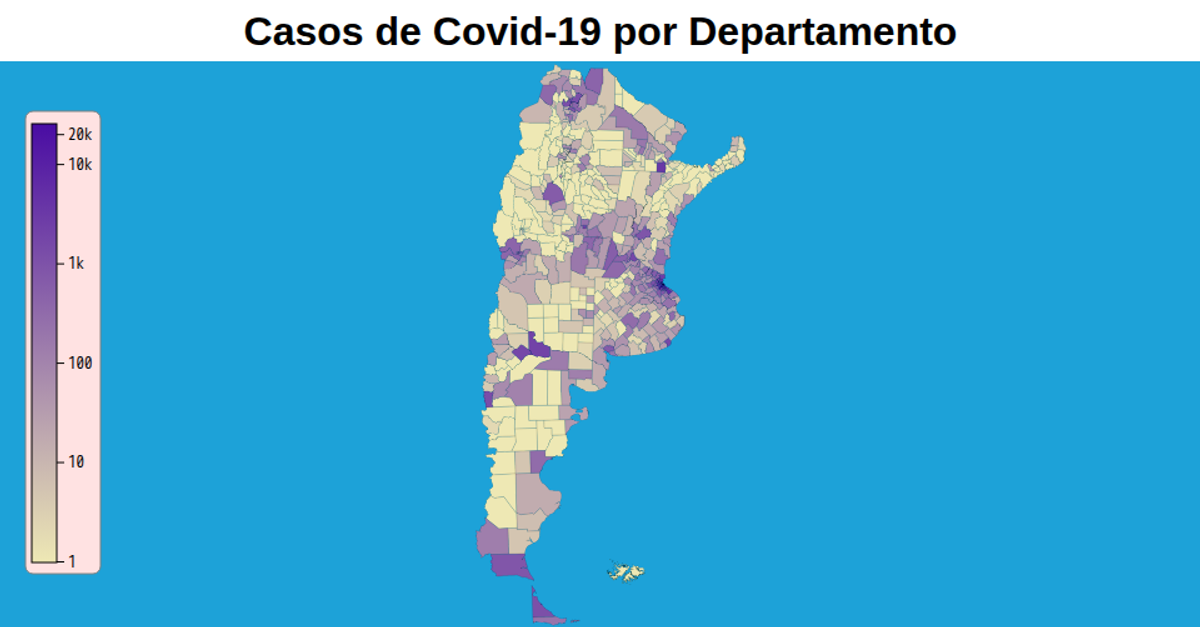
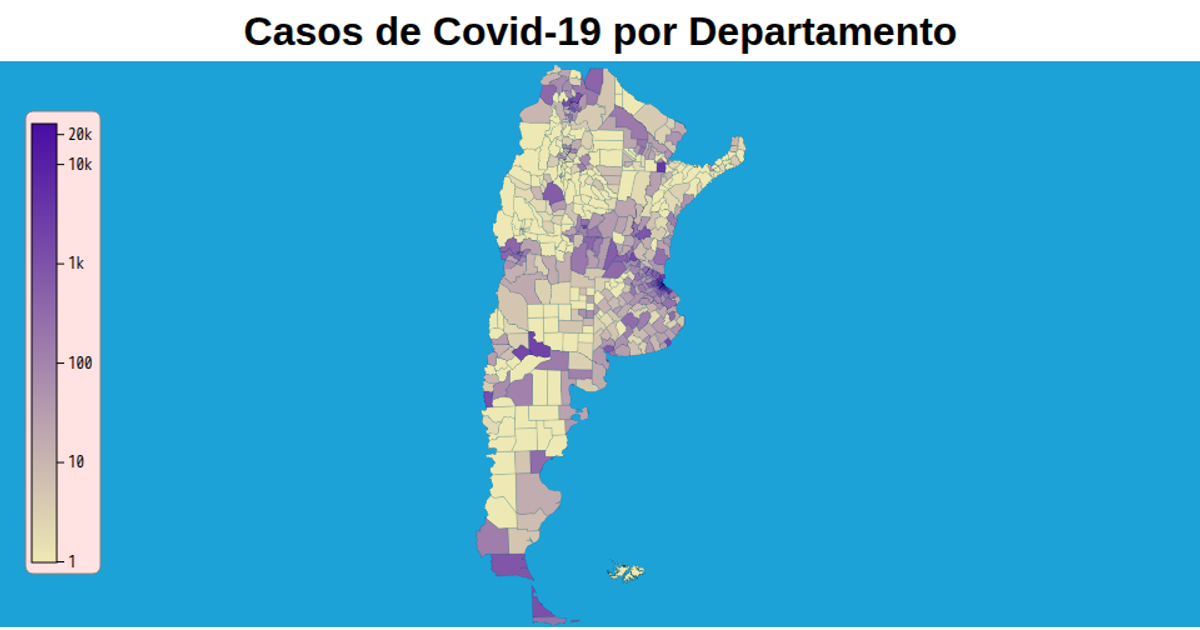
A choropleth map of Argentina shows confirmed COVID-19 cases per department, colored on a logarithmic scale from pale yellow to deep purple with hover tooltips. The visualization uses d3.geoPath with a transverse Mercator projection and TopoJSON data from a GitHub repository, rendering as SVG with zoom support via d3.zoom. A gradient legend and logarithmic axis with tick values provide context. A background sphere path and uncommented province outlines frame the map.
AI-generated descriptionVersion 70mb más liviana (77.8mb vs 6.3mb)
MIT Licensed





Comments
Sign in to join the discussion.