🌍 Public
Fork of Choropleth Map Argentina Dptos Corona (Topojson)
Aaniosindustries
Last edited Nov 1, 2021
Created on Nov 1, 2021
Forked from Choropleth Map Argentina Dptos Corona (Topojson)
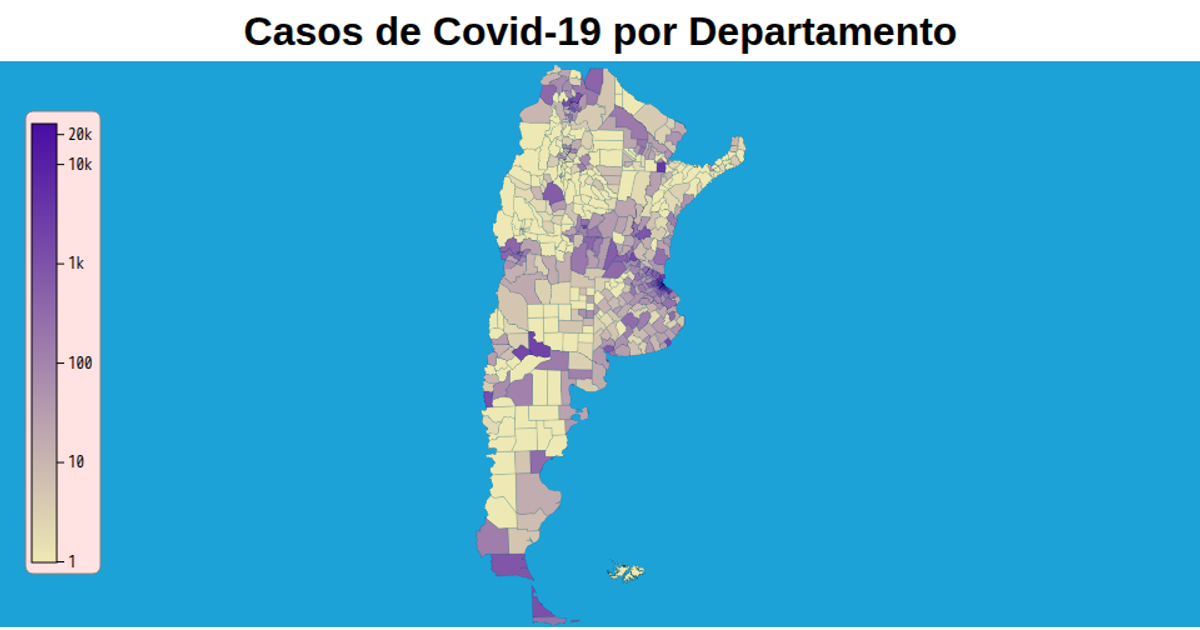
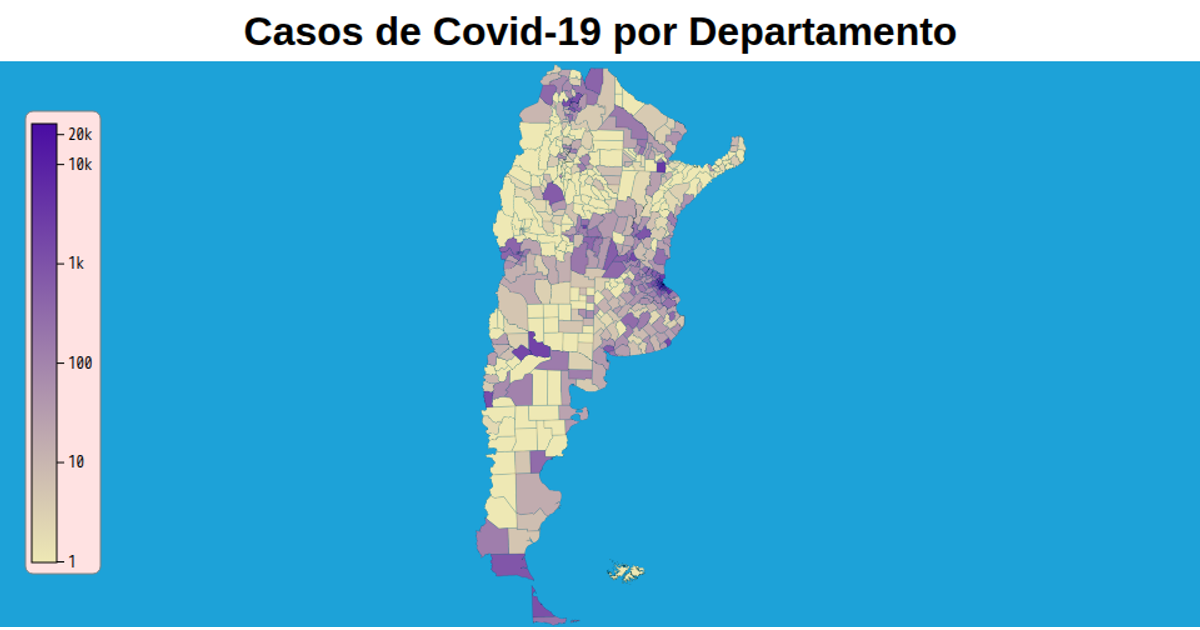
This choropleth map shows confirmed COVID-19 cases per department in Argentina, with a logarithmic color scale from light yellow to deep purple and a corresponding axis legend. The visualization uses d3.geoPath with a geoTransverseMercator projection to render TopoJSON data from a GitHub repository, displaying department names and case counts via tooltips. Zooming via d3.zoom enables interactive exploration, while d3.scaleLog maps case values to an SVG linear gradient. The map includes hover effects, province borders, and a custom axis using d3.axisRight with formatted tick labels.
AI-generated descriptionVersion 70mb más liviana (77.8mb vs 6.3mb)
MIT Licensed





Comments
Sign in to join the discussion.