🌍 Public
Egypt Map
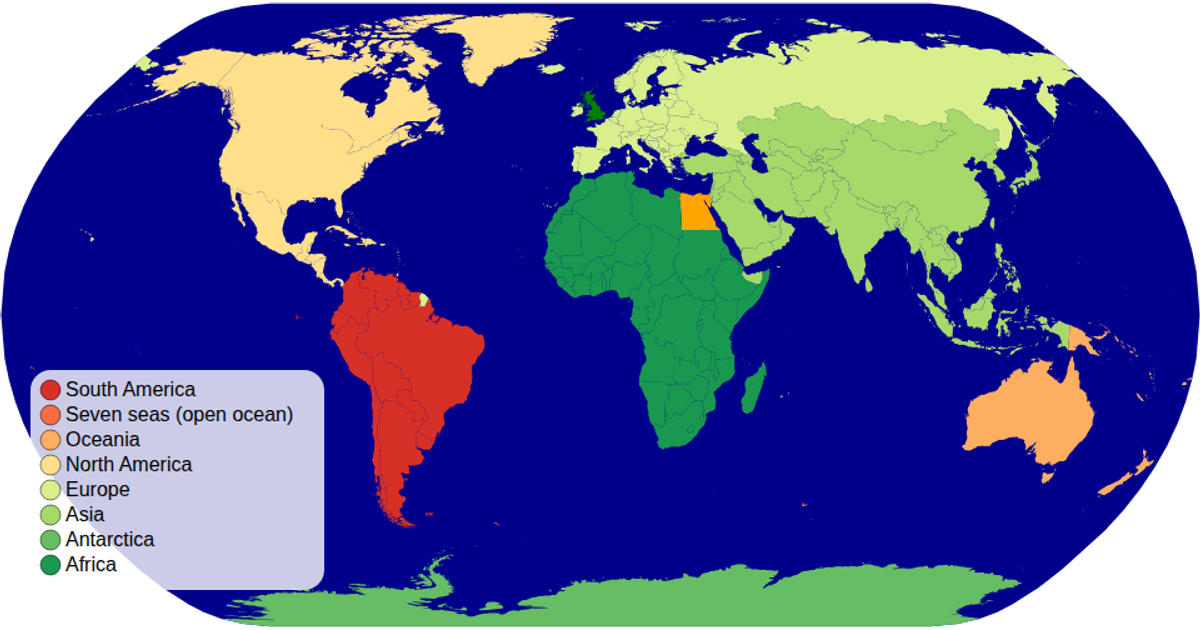
A simple choropleth-style map displays Egypt's governorates as gray polygons with light gray outlines. Using TopoJSON data loaded from an external file, the example projects the country's boundaries with a Mercator projection fitted to the viewport. The code employs `d3.geoPath` with `topojson.feature` to render each governorate as an SVG path, filling all regions uniformly with `#f7f7f7` and stroking them with `#999`. The visualization relies on D3 v7's selection and join methods to bind the geographic features to the document.
AI-generated descriptionMIT Licensed



Comments
Sign in to join the discussion.