🌍 Public
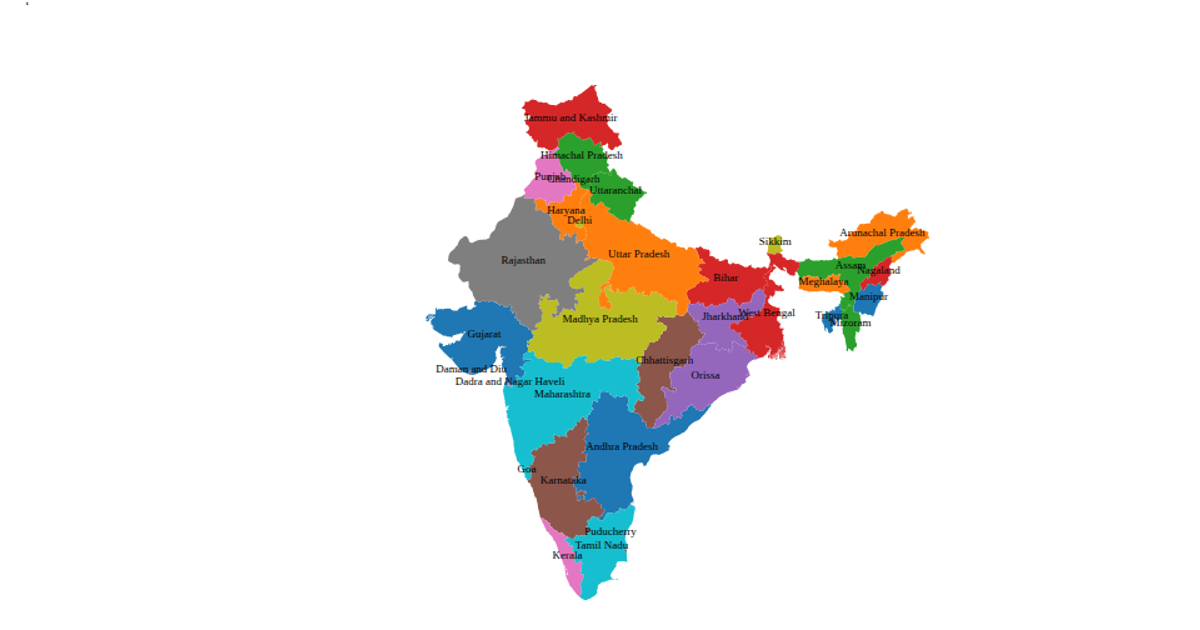
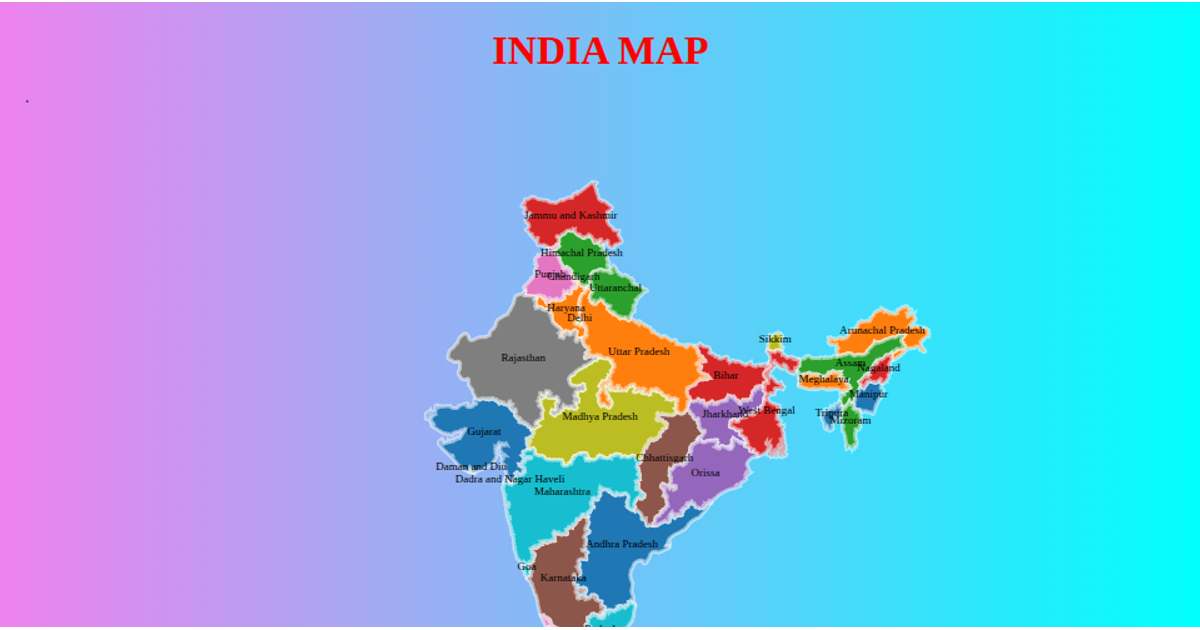
Map of India
A choropleth map of Tunisia displays each delegation as a colored polygon, using a paired color scheme to differentiate regions and a hover effect that turns polygons maroon. The visualization is rendered with SVG via d3.geoPath and a d3.geoMercator projection, loading TopoJSON data from a remote GitHub repository. Interactive zooming is enabled through d3.zoom, which applies transforms to the map group, and tooltips appear via appended title elements.
AI-generated descriptionMIT Licensed





Comments
Sign in to join the discussion.