🌍 Public
SC Counties2
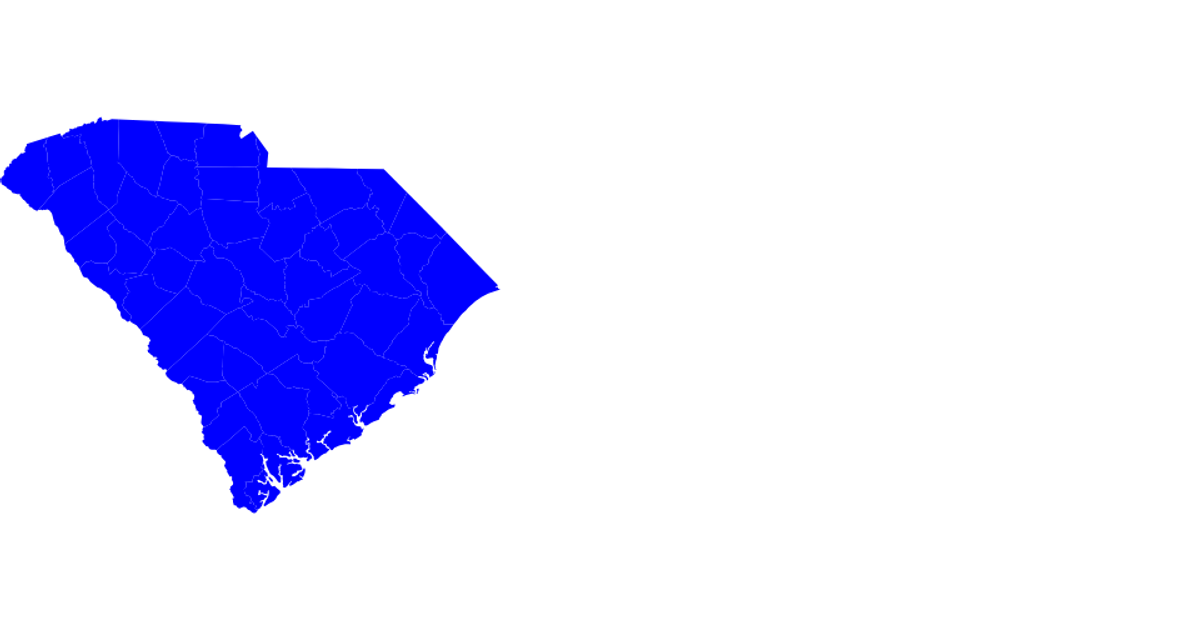
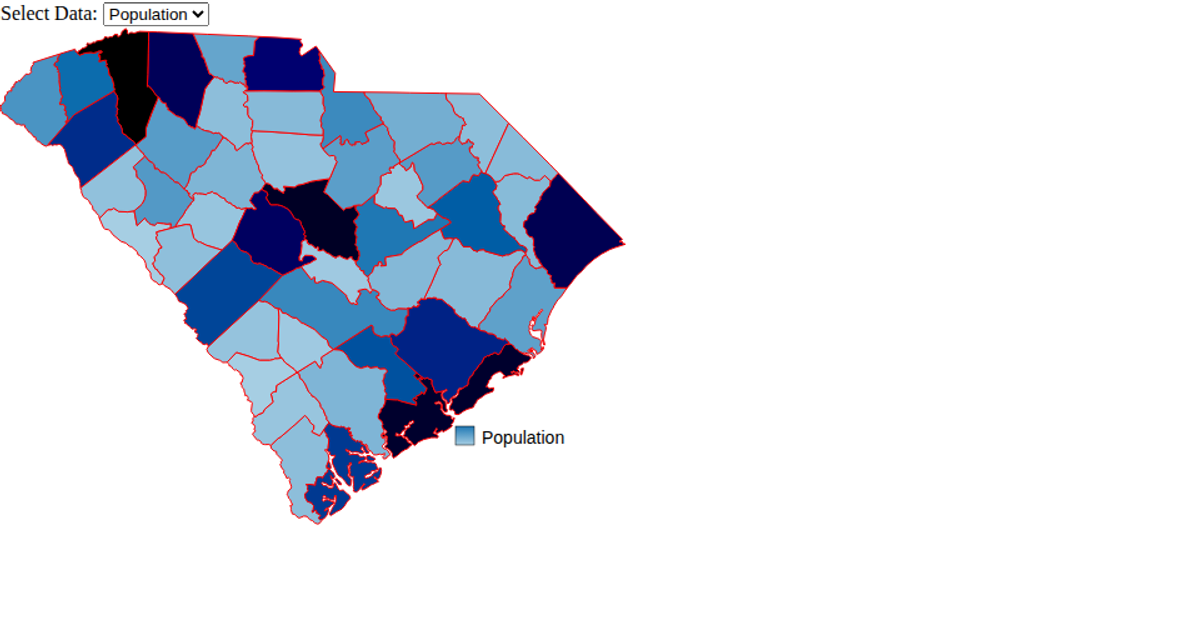
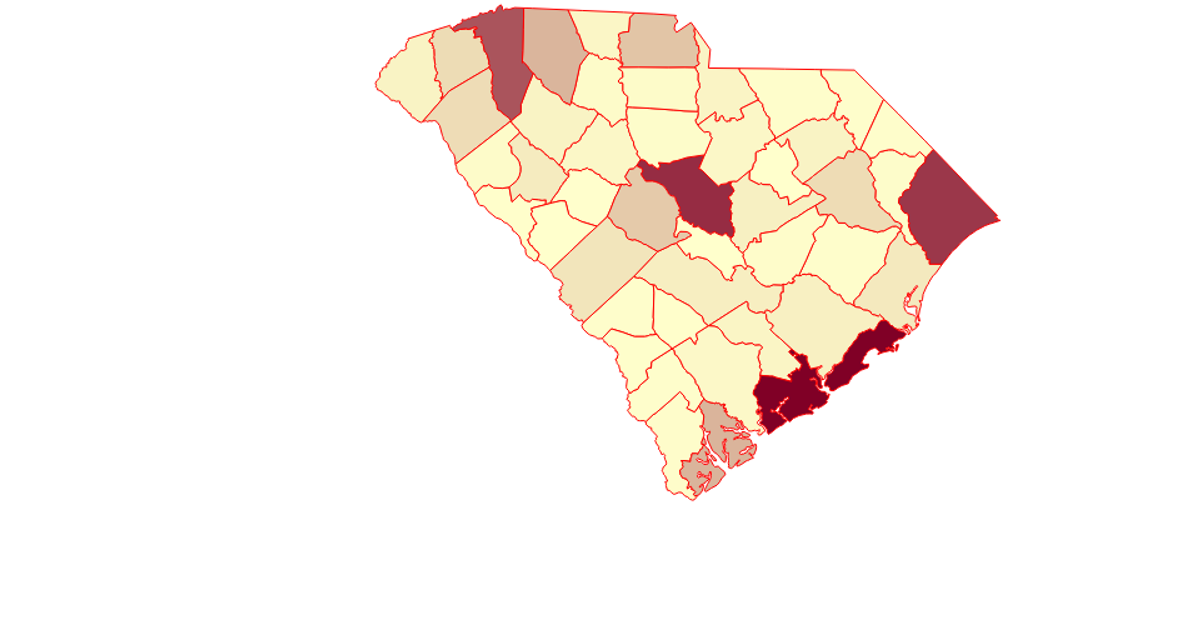
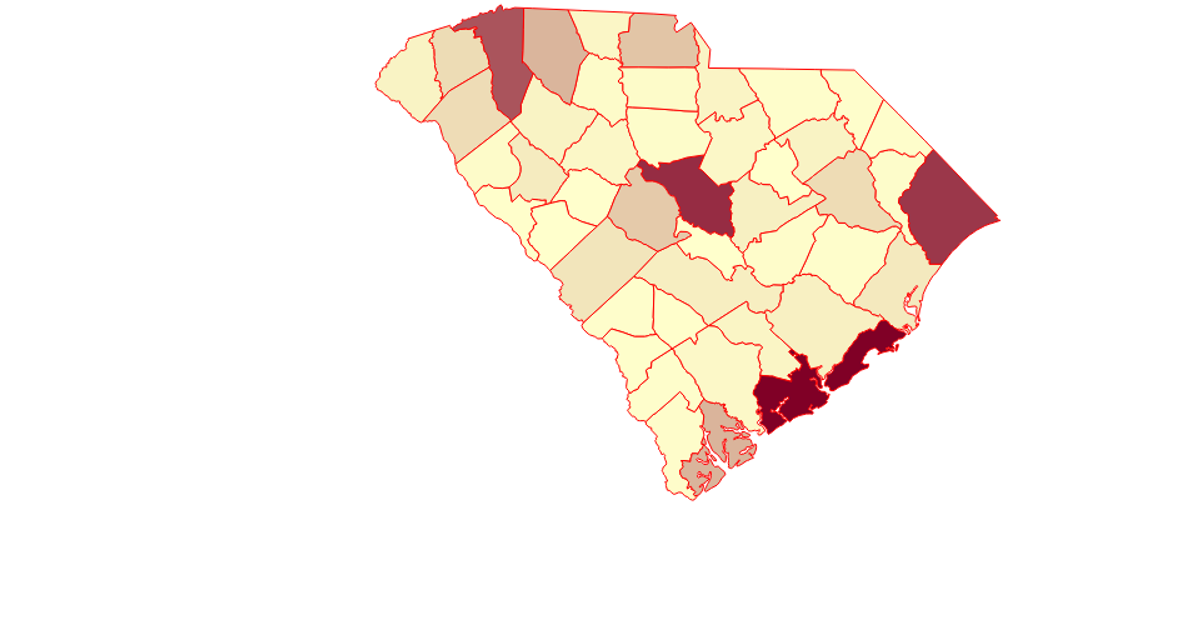
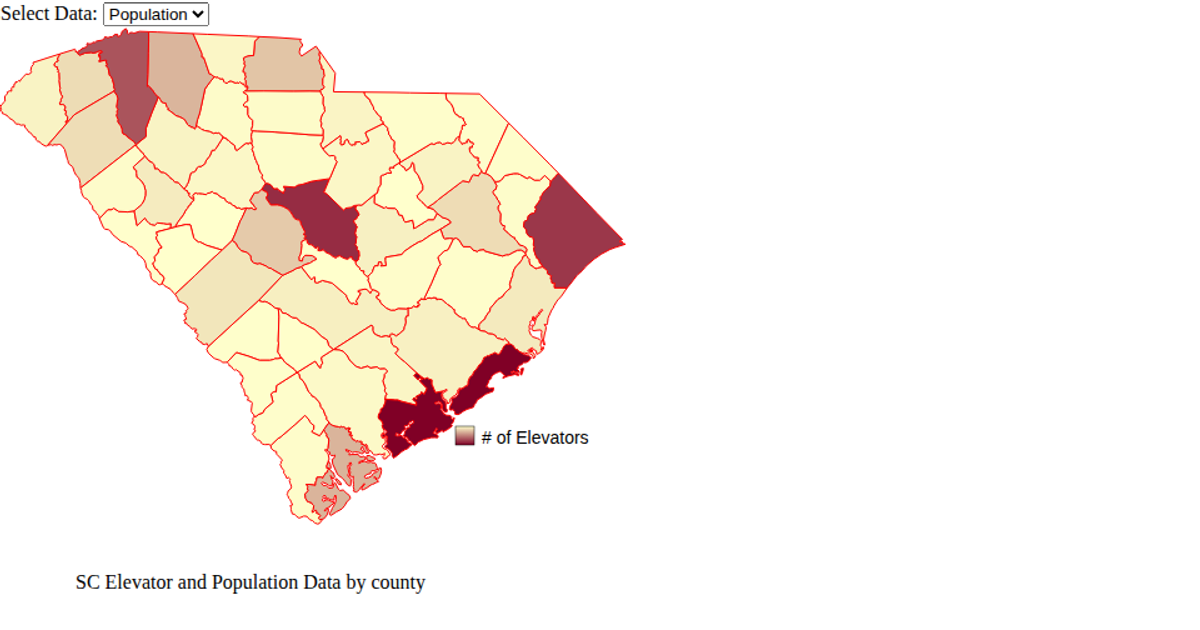
This example displays a choropleth map of South Carolina counties, coloring each county blue or red based on whether its ID matches the value "06". It renders the GeoJSON data as SVG paths using D3's `geoPath()` projection. The code loads D3 via UNPKG, fetches geographic data from a raw GitHub GeoJSON URL, and demonstrates importing from local ES6 modules alongside D3's `select` API.
AI-generated descriptionAn example showing the capabilities of VizHub:
- Loads D3 via UNPKG.
- Demonstrates use of
importfrom"d3". - Demonstrates use of
importfrom local ES6 modules.
MIT Licensed


Comments
Sign in to join the discussion.