🌍 Public
south carolina counties
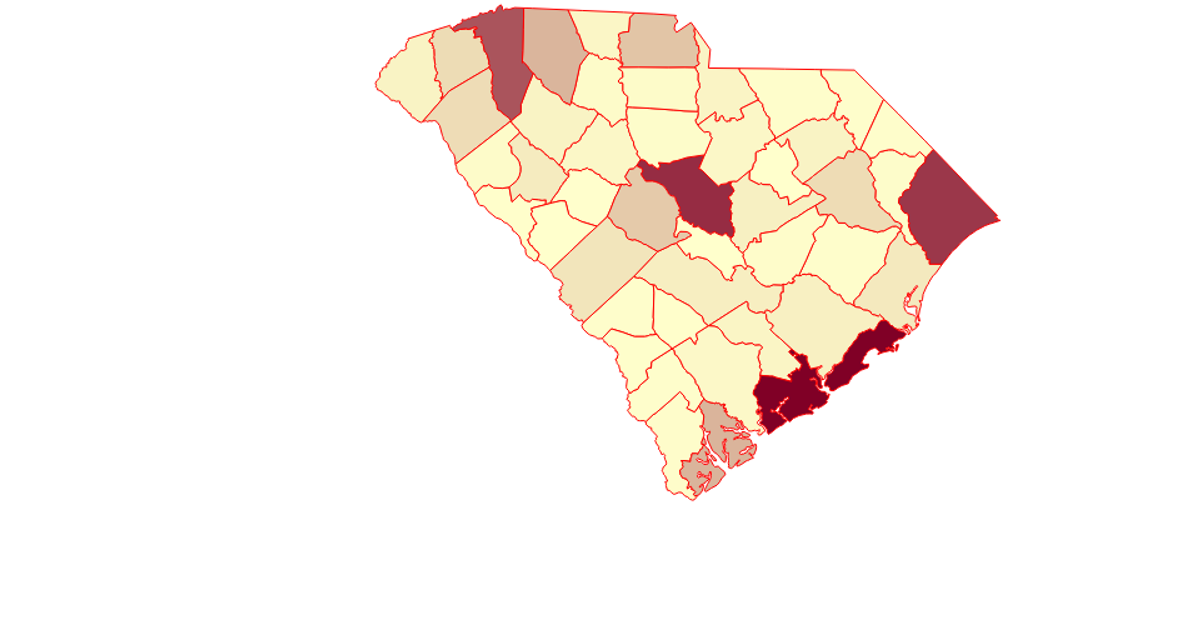
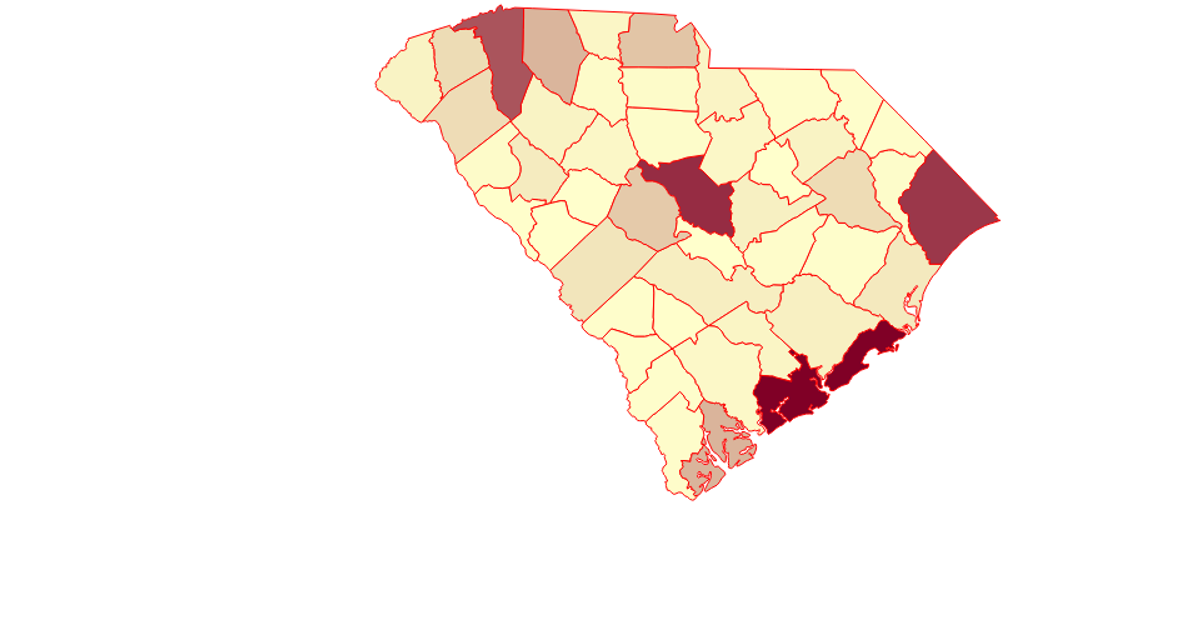
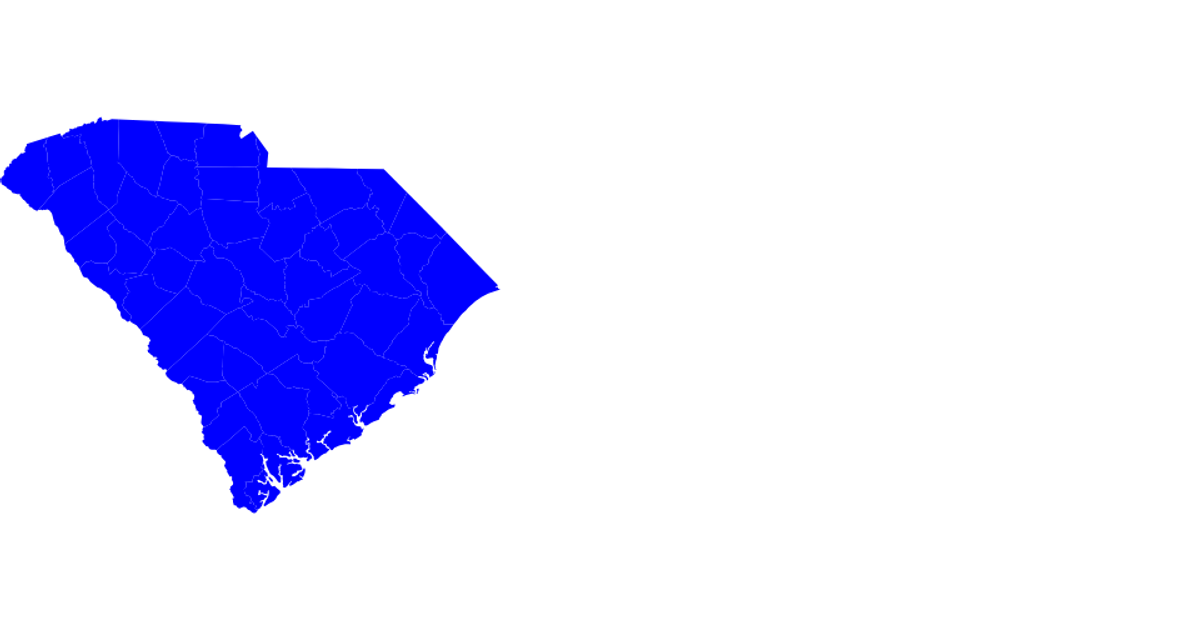
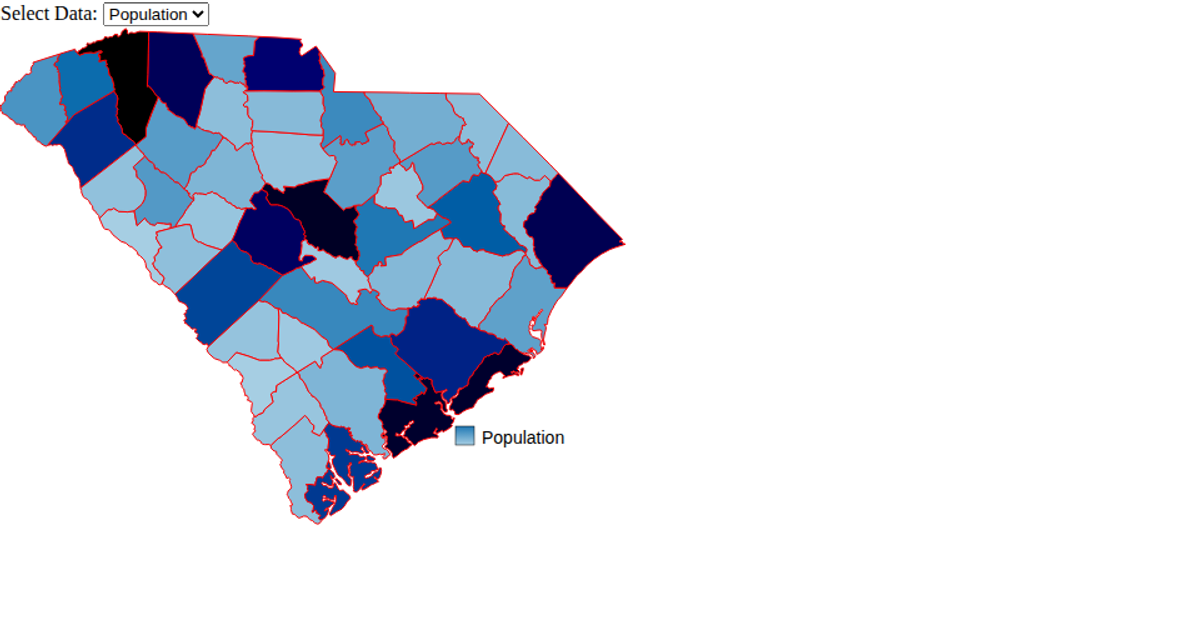
This example displays a map of South Carolina counties, coloring each county path either red or blue based on its state ID. It loads geographic data from a remote JSON file and uses TopoJSON to convert it into GeoJSON features for rendering. The visualization relies on D3’s `select` and `attr` methods to configure an SVG canvas, while `d3.geoPath` is used to generate the path data for each county shape. The code also demonstrates importing local ES6 modules and logging county geometry coordinates.
AI-generated descriptionAn example showing the capabilities of VizHub:
- Loads D3 via UNPKG.
- Demonstrates use of
importfrom"d3". - Demonstrates use of
importfrom local ES6 modules.
MIT Licensed




Comments
Sign in to join the discussion.