🌍 Public
SC4
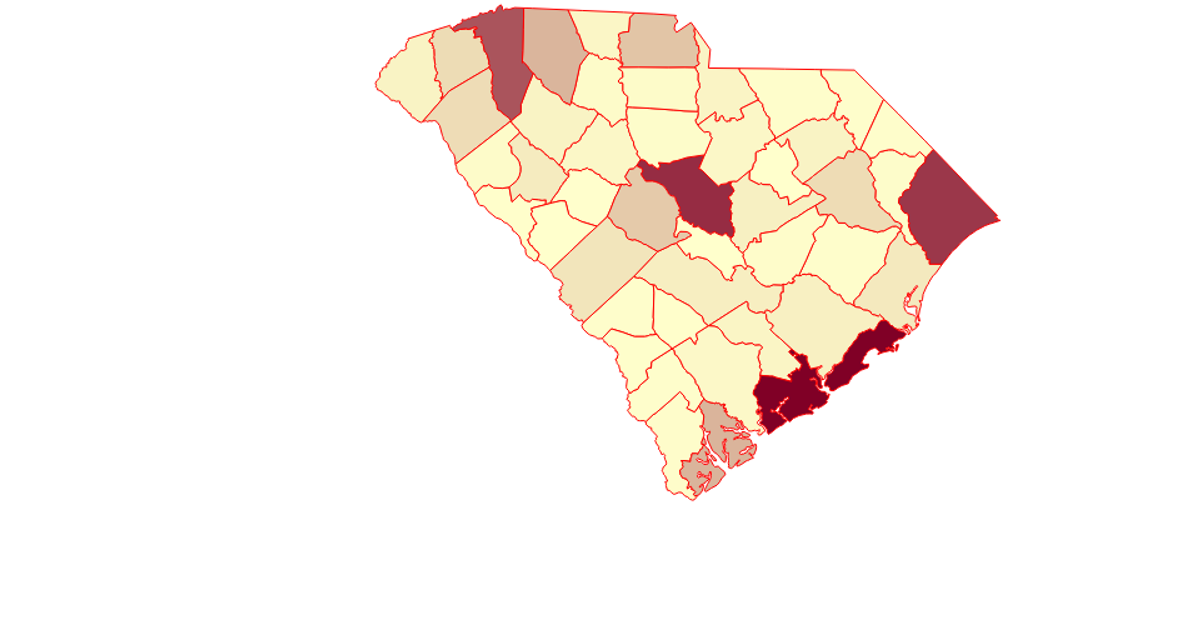
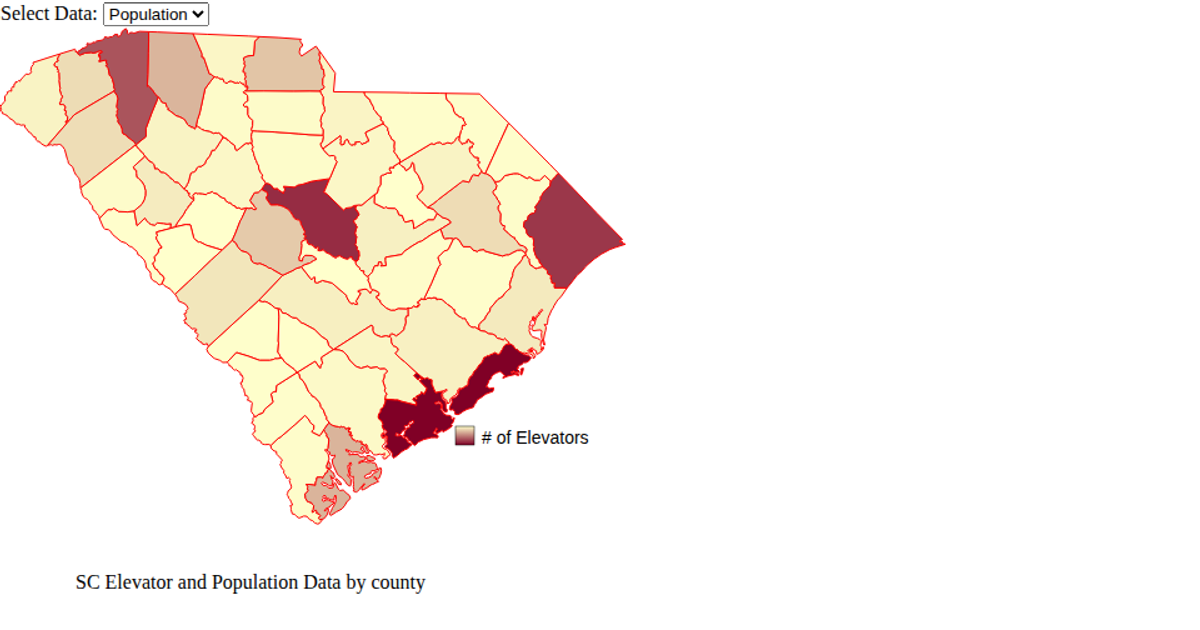
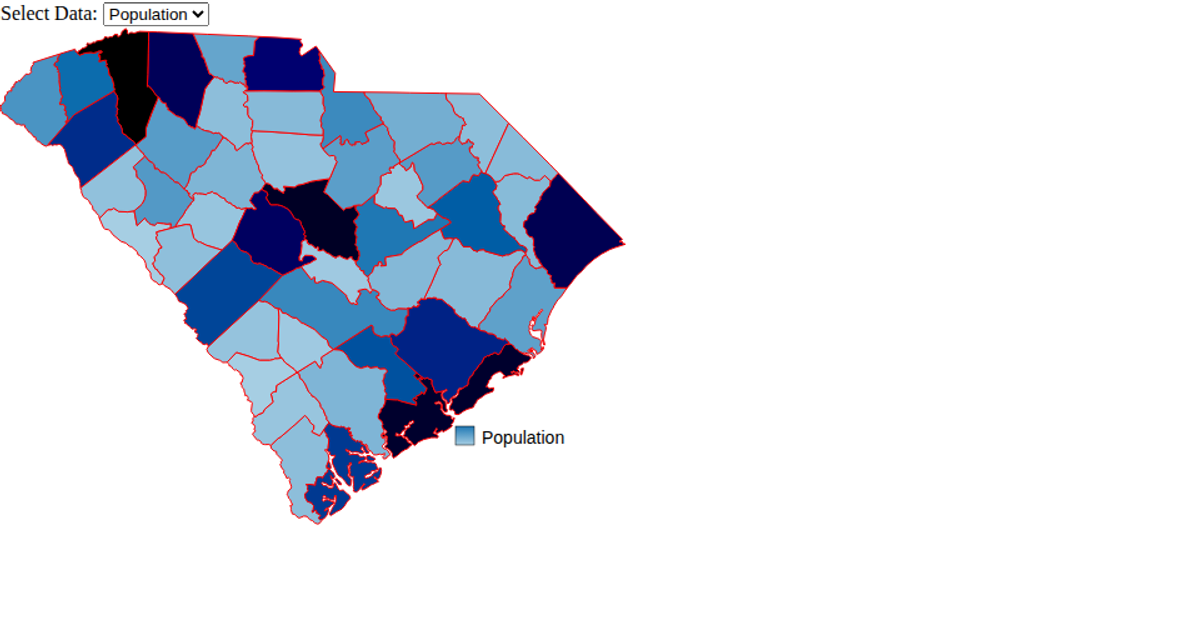
This visualization shows the distribution of grain elevators across South Carolina counties, with each county shaded on a color scale from light yellow to dark red based on the number of elevators it contains. Hovering over a county highlights it in blue and displays a tooltip with the county name and elevator count. The map is rendered using SVG paths from a GeoJSON file, projected with `d3.geoMercator` and `d3.geoPath`, while elevator data is loaded from a CSV. The color scale uses `d3.scaleLinear` with `d3.extent` to set the domain, and tooltips are implemented as a D3 selection appended to the page.
AI-generated descriptionAn example showing the capabilities of VizHub:
- Loads D3 via UNPKG.
- Demonstrates use of
importfrom"d3". - Demonstrates use of
importfrom local ES6 modules.
MIT Licensed




Comments
Sign in to join the discussion.