🌍 Public
Fork of WAEVData_Fork of Chloropleth
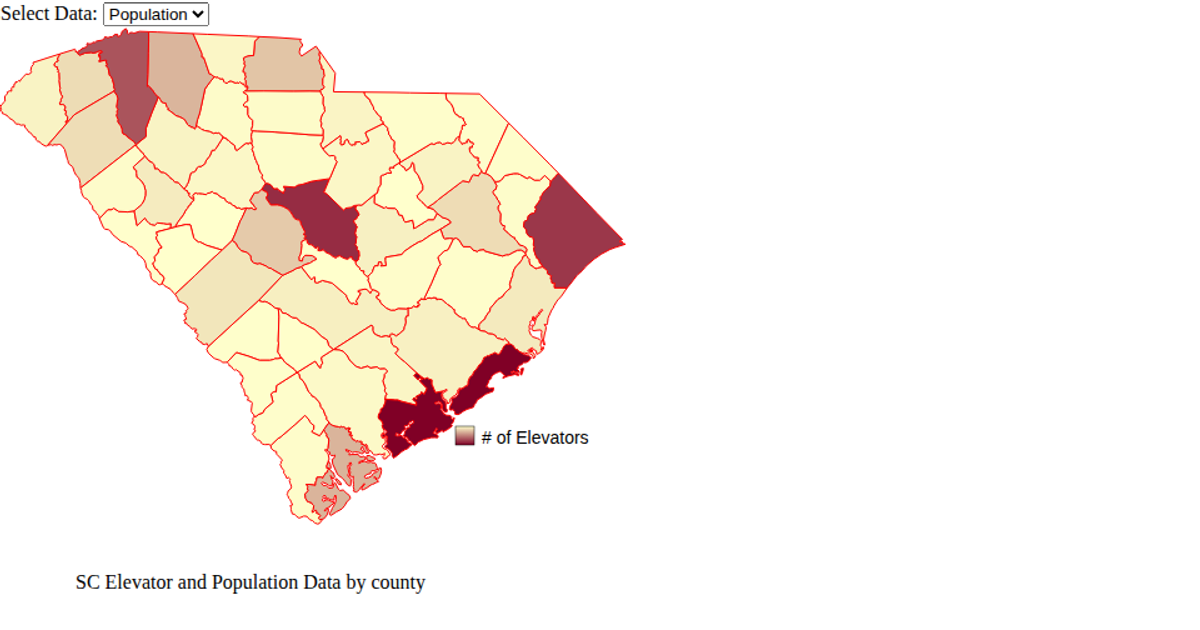
This fork visualizes South Carolina county boundaries using a Mercator projection, rendered via two side-by-side SVG canvases with each county filled in blue using `d3.geoPath`. The code loads GeoJSON map data from a GitHub repository alongside a CSV dataset, though the CSV is fetched but not directly used in the visible rendering. Built with D3.js v6 and React, the example demonstrates a static choropleth foundation, creating SVG paths for each geographic feature through `d3.json` and `d3.csv` promises.
AI-generated descriptionA bare minimum HTML page demonstrating use of CSS and JavaScript.
See also React Starter.
MIT Licensed






Comments
Sign in to join the discussion.