🌍 Public
Tree Visualization
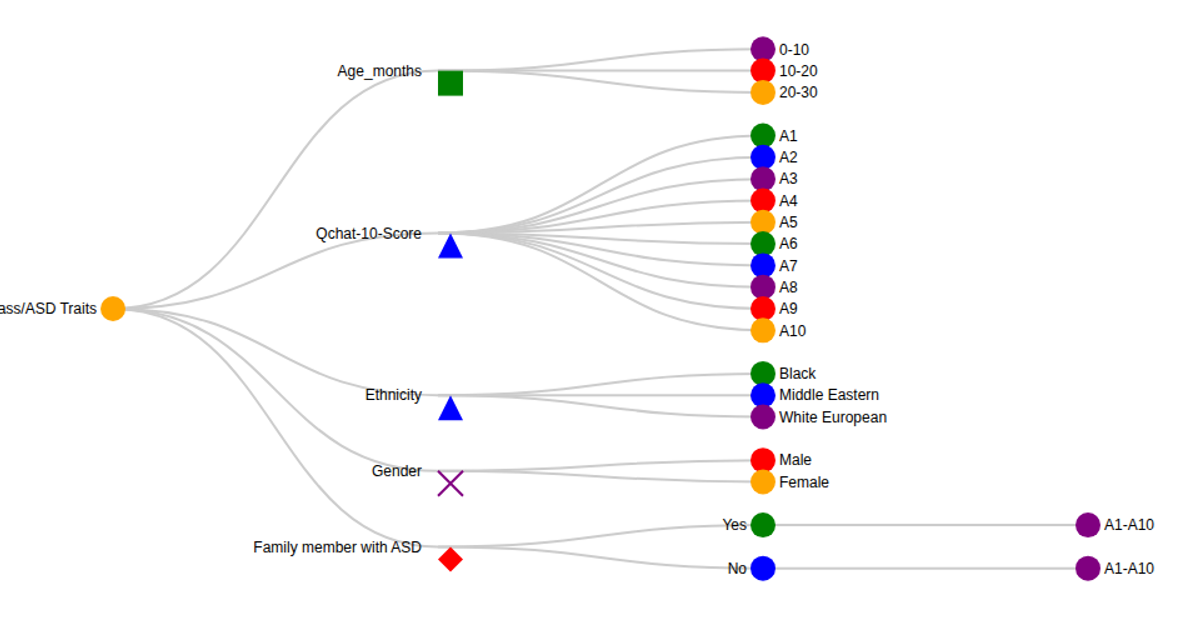
This tree visualization shows the hierarchical breakdown of ASD traits, branching from the root into categories like Age, Severity, Ethnicity, Gender, and Family History, with leaf nodes representing specific trait values. The SVG rendering uses the `d3.tree` layout to compute node positions, `d3.hierarchy` to structure the data, and `d3.scaleOrdinal` with `d3.schemeCategory10` to color nodes by depth. Links are drawn as cubic Bézier paths, and each node displays a circle and text label.
AI-generated descriptionMIT Licensed




Comments
Sign in to join the discussion.