🌍 Public
Network Graph
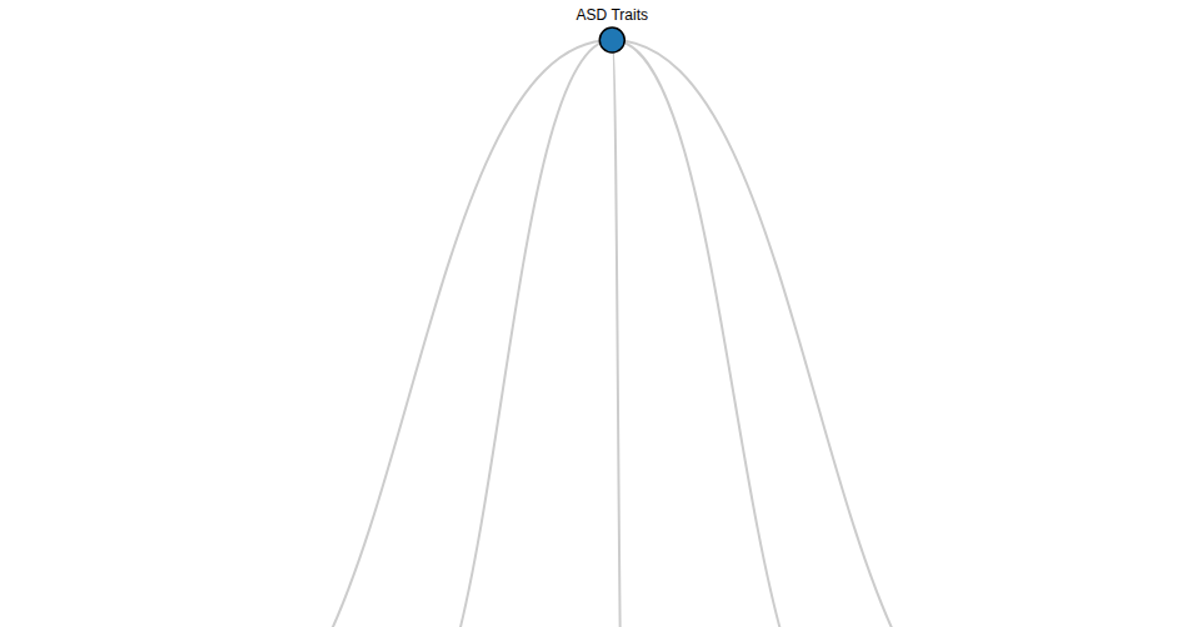
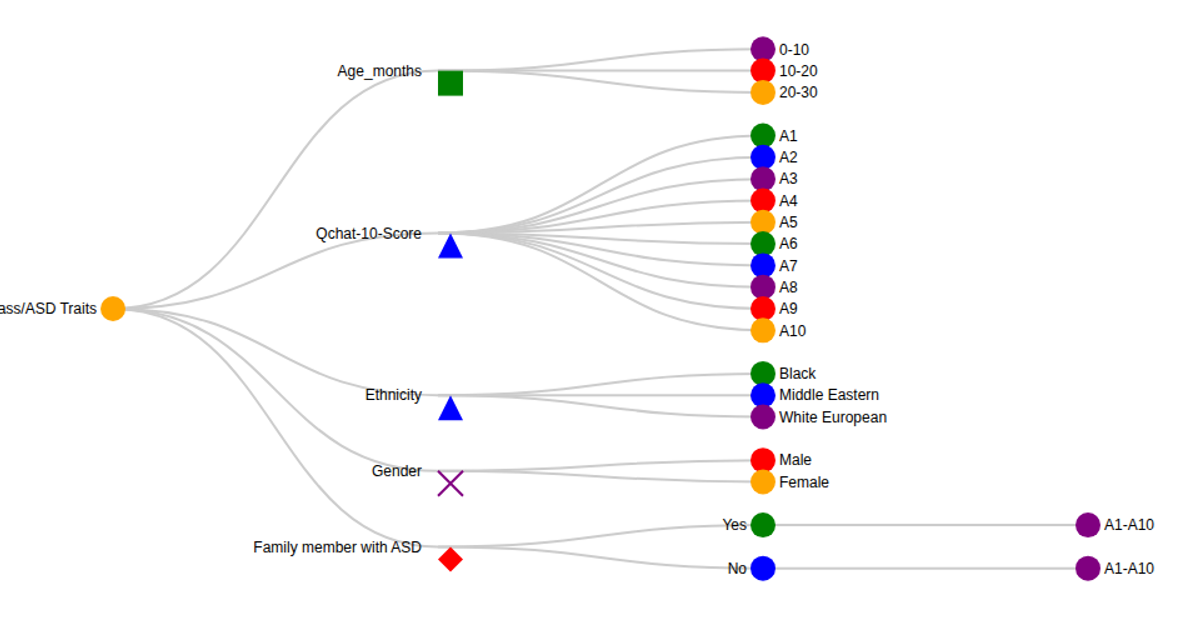
This interactive network graph visualizes relationships among Autism Spectrum Disorder (ASD) traits, categorizing nodes into primary, secondary, and tertiary groups. The force-directed layout uses `d3.forceSimulation` to position nodes, with links connecting concepts like age groups, severity levels, and demographic factors. The SVG rendering applies a categorical color scheme via `d3.scaleOrdinal` and supports dragging nodes through `d3.drag()` callbacks. The dataset is embedded directly in the code, with node radii varying by hierarchy level.
AI-generated descriptionMIT Licensed




Comments
Sign in to join the discussion.