🌍 Public
Network
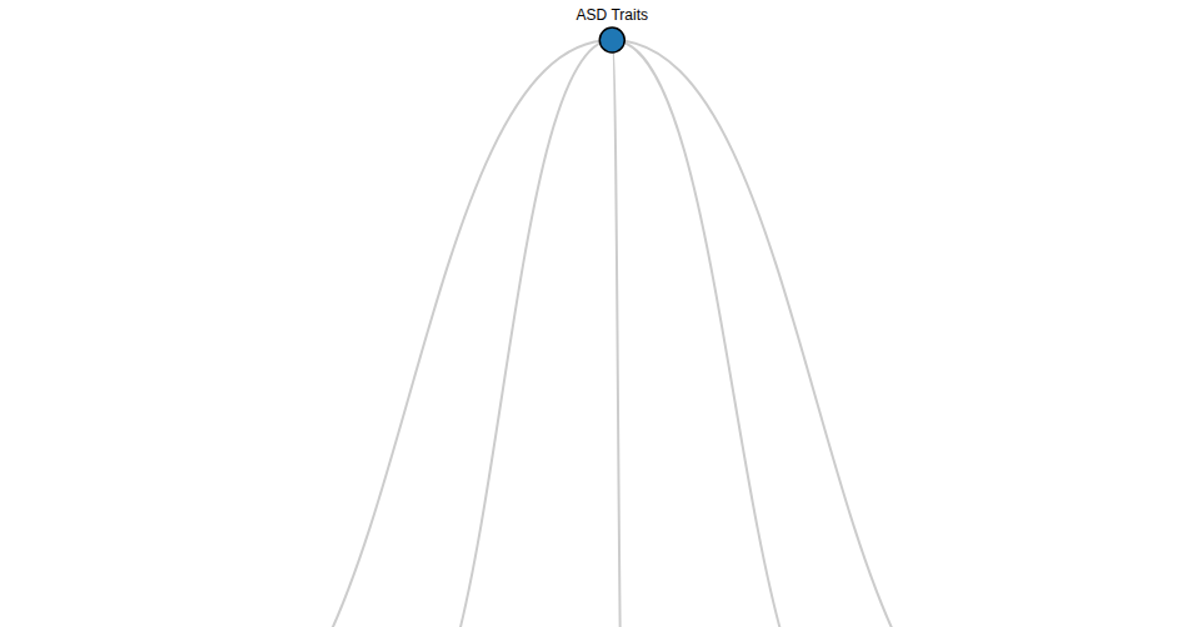
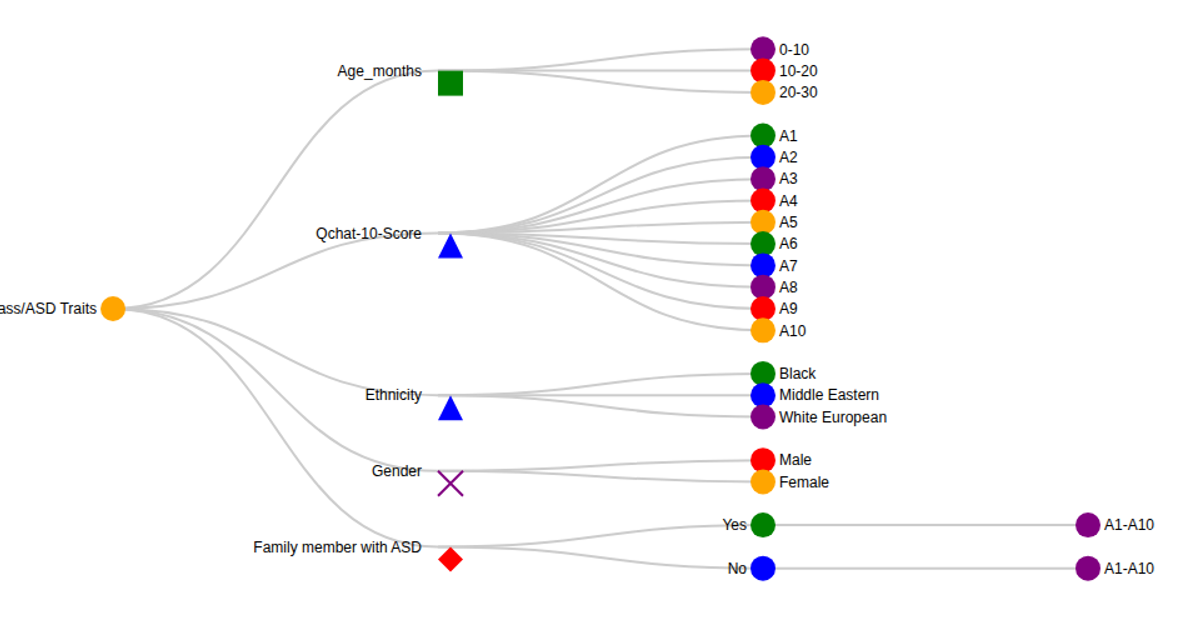
This visualization shows a hierarchical breakdown of ASD traits, displaying counts for individuals with and without the condition, further categorized by ethnicity, gender, and jaundice status. The data is presented as an interactive tree diagram where nodes represent each category and branches connect related groups. The visualization uses the D3.js library with its force-directed graph layout, rendering the tree as an SVG with custom styling for node circles and connecting links. The root node uses a specific color, while leaf nodes are white with steelblue stroke.
AI-generated descriptionMIT Licensed





Comments
Sign in to join the discussion.