🌍 Public
Tree
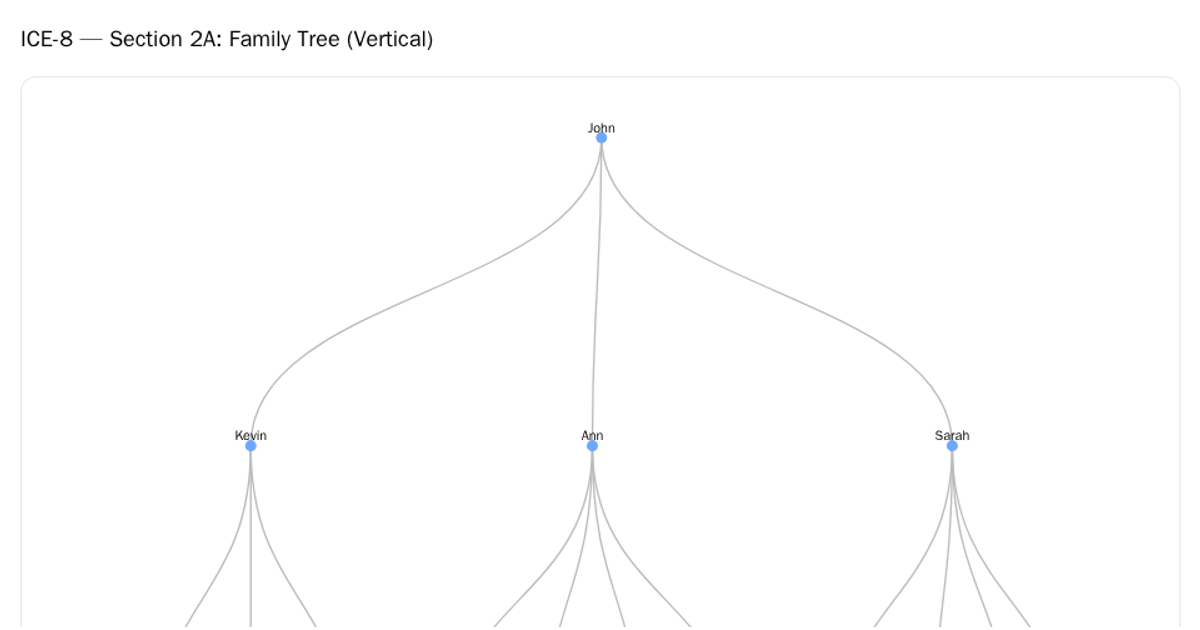
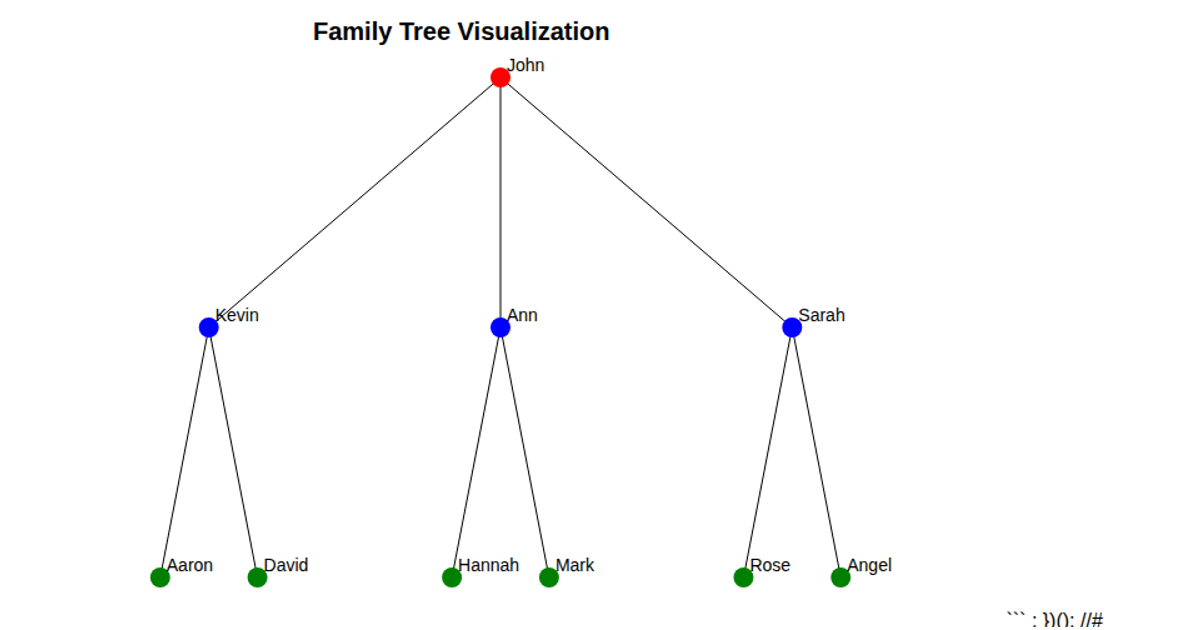
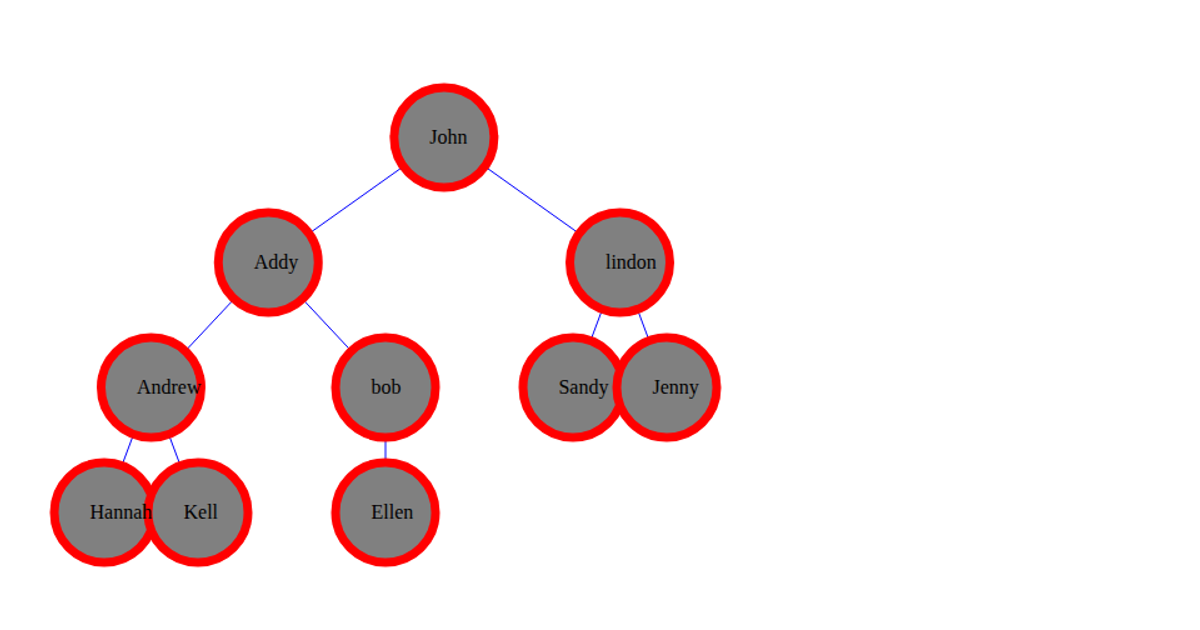
This tree visualization displays a five-generation family hierarchy, with each generation distinguished by both color and node shape, ranging from circles for the root and parents to squares, diamonds, and triangles for subsequent descendants. The D3.js code uses the `d3.stratify()` and `d3.tree()` APIs to convert flat data into a hierarchical structure and compute the layout, drawing links as lines and rendering nodes as SVG shapes within a white-bordered chart. A legend above the chart clarifies the mapping of generation to shape and color.
AI-generated descriptionMIT Licensed


Comments
Sign in to join the discussion.