🌍 Public
Tree
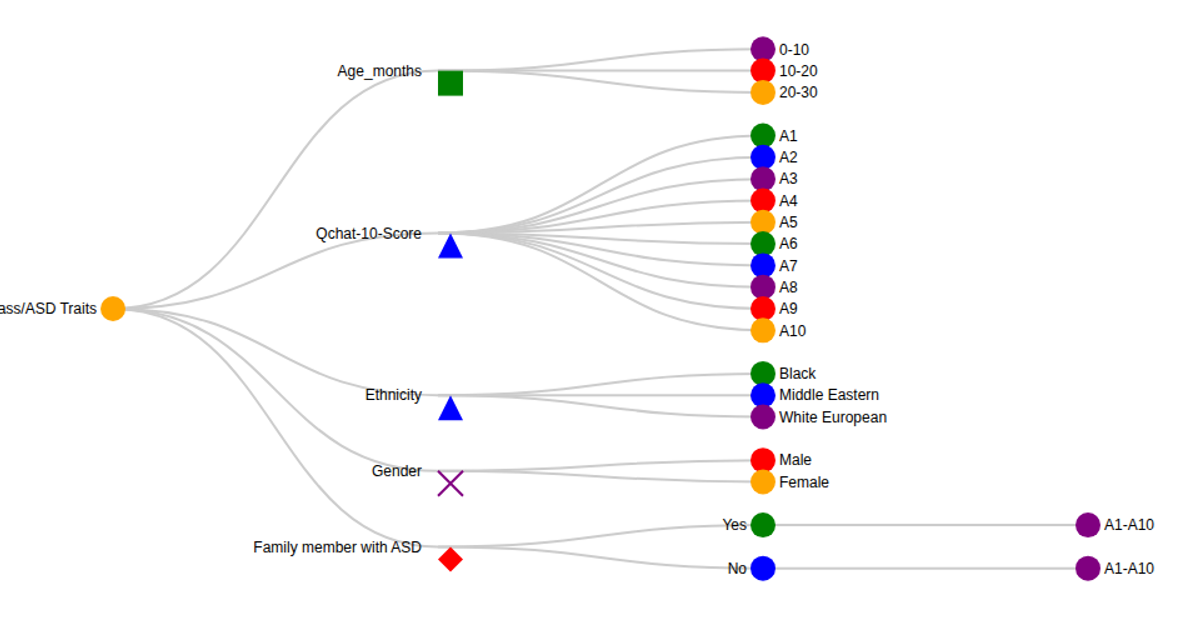
This tree diagram visualizes the age range and gender distribution of toddlers, grouping the data into three age brackets and splitting each by sex. The hierarchical layout uses d3.tree() to position nodes and d3.linkHorizontal() to draw curved links between parent and child nodes. The visualization reads from a CSV file of toddler demographic data, rendered as SVG with circles and text labels appended to each node. The d3.group() method structures the raw data into a nested hierarchy before applying the layout.
AI-generated descriptionMIT Licensed



Comments
Sign in to join the discussion.