🌍 Public
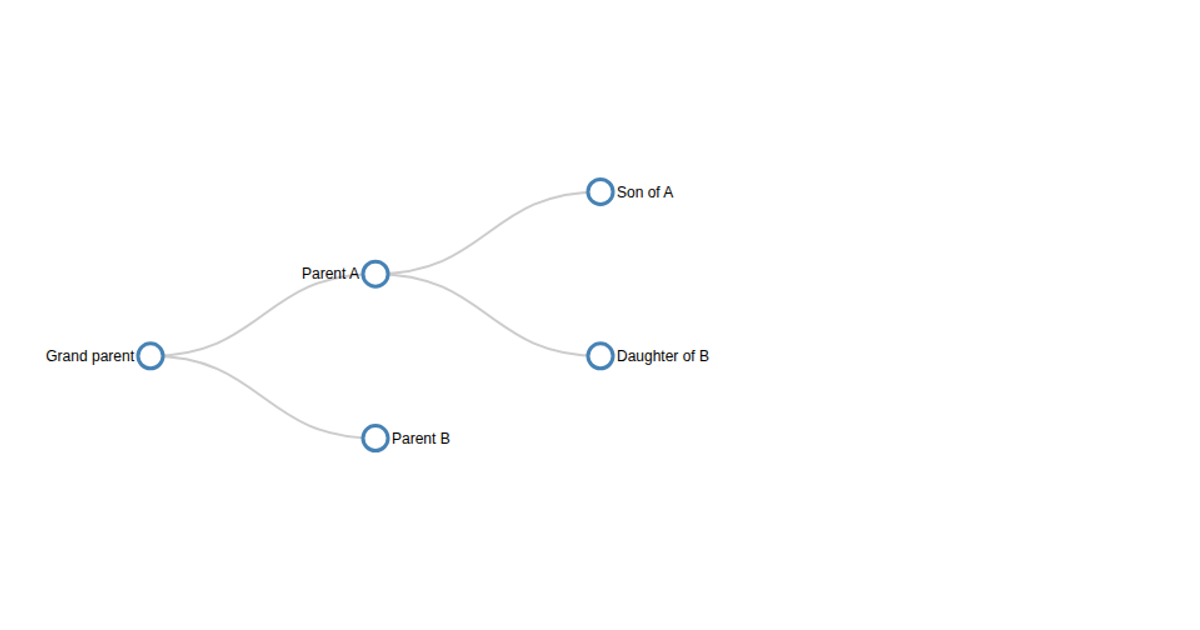
Tree
This example shows a network diagram of age ranges (in years) computed from toddler data, visualizing transitions between sequential age groups. Nodes representing each year are connected by links, with a force-directed layout placing them dynamically. The visualization uses d3.forceSimulation to manage the physics, d3.forceLink and d3.forceManyBody for attraction and repulsion, and d3.forceCenter for centering. The SVG renders circles and lines, with drag interaction via d3.drag allowing users to reposition nodes. Data is loaded from a CSV file specifying ages in months.
AI-generated descriptionA bare minimum HTML page demonstrating use of CSS and JavaScript.
See also React Starter.
MIT Licensed




Comments
Sign in to join the discussion.