🌍 Public
Fork of Transforming Data Cheetahs Francesca Sajedi
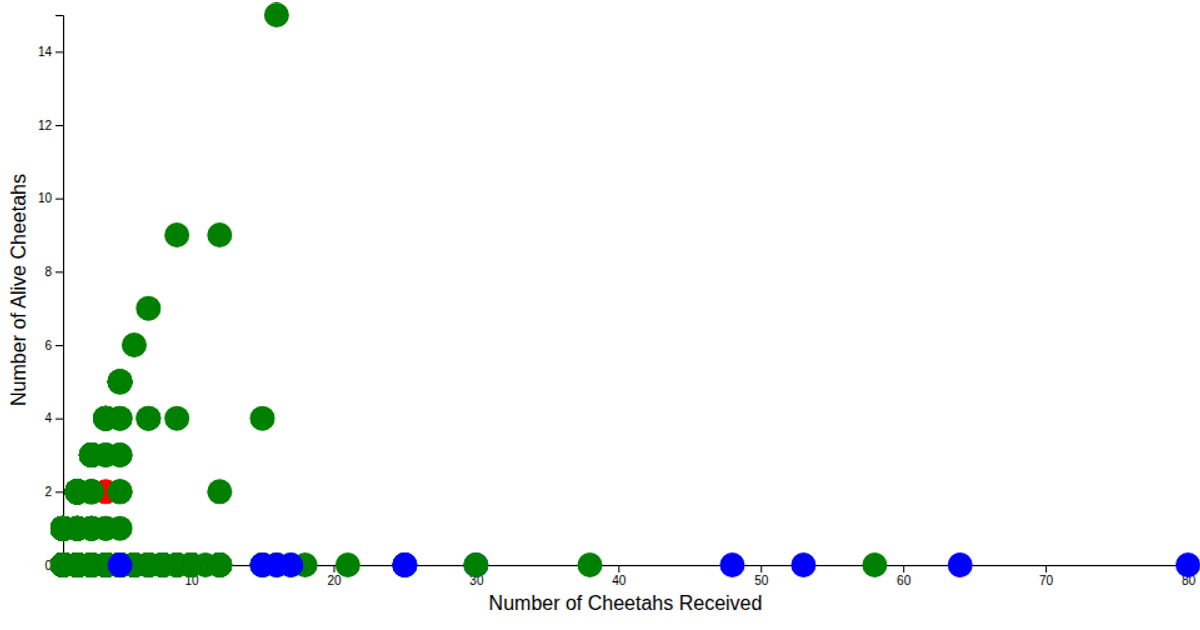
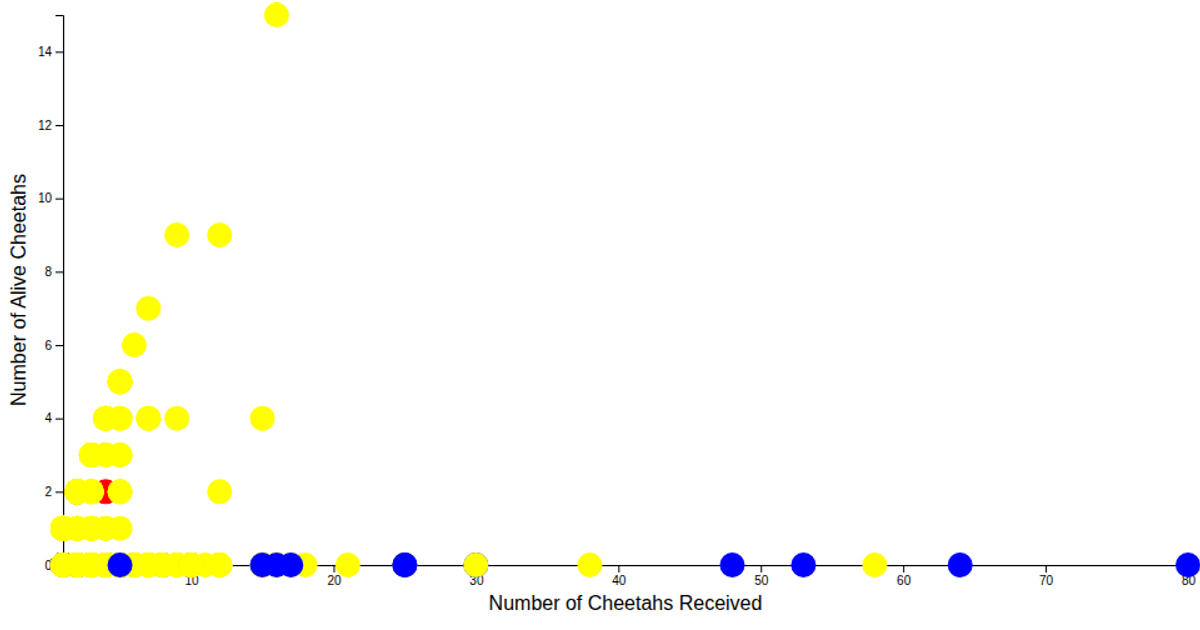
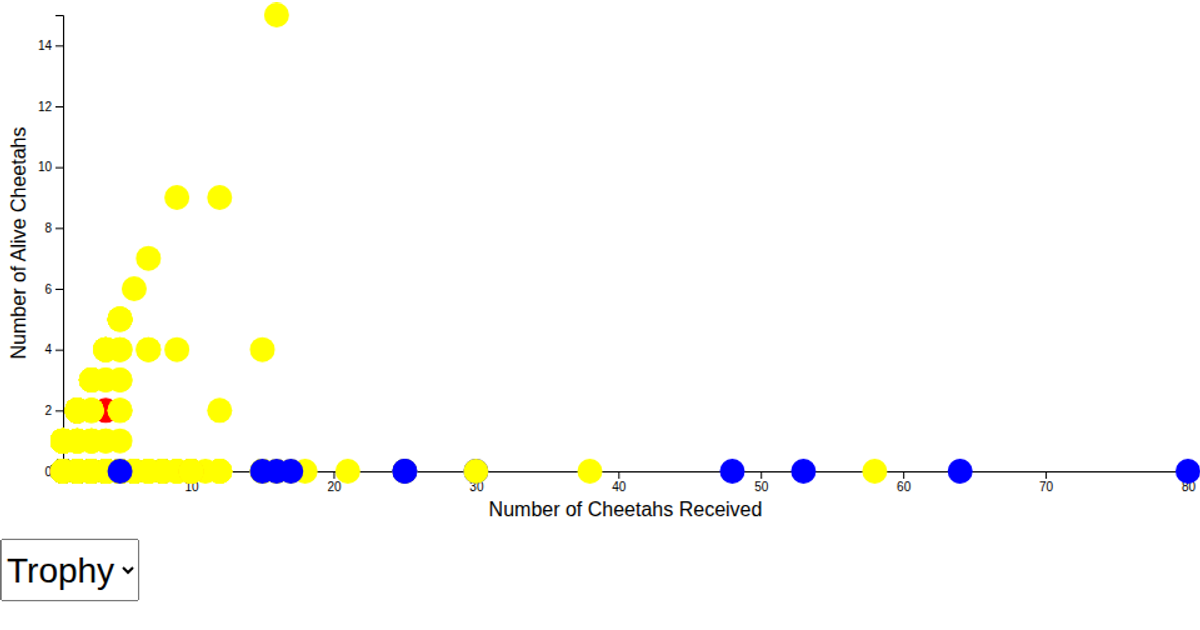
This visualization aggregates cheetah trafficking incident data from a CSV file, summing the number of cheetahs per region and per country using `d3.flatRollup` and `d3.sum`. The results are displayed as raw JSON text in `<pre>` elements. The code uses `d3.csvParse` to load the data and `d3.select` for DOM manipulation, though no graphical rendering is implemented.
AI-generated descriptionExamples of various data transformation techniques, specifically binned aggregation.
MIT Licensed




Comments
Sign in to join the discussion.