🌍 Public
Fork of Scatter Plot with Color Francesca
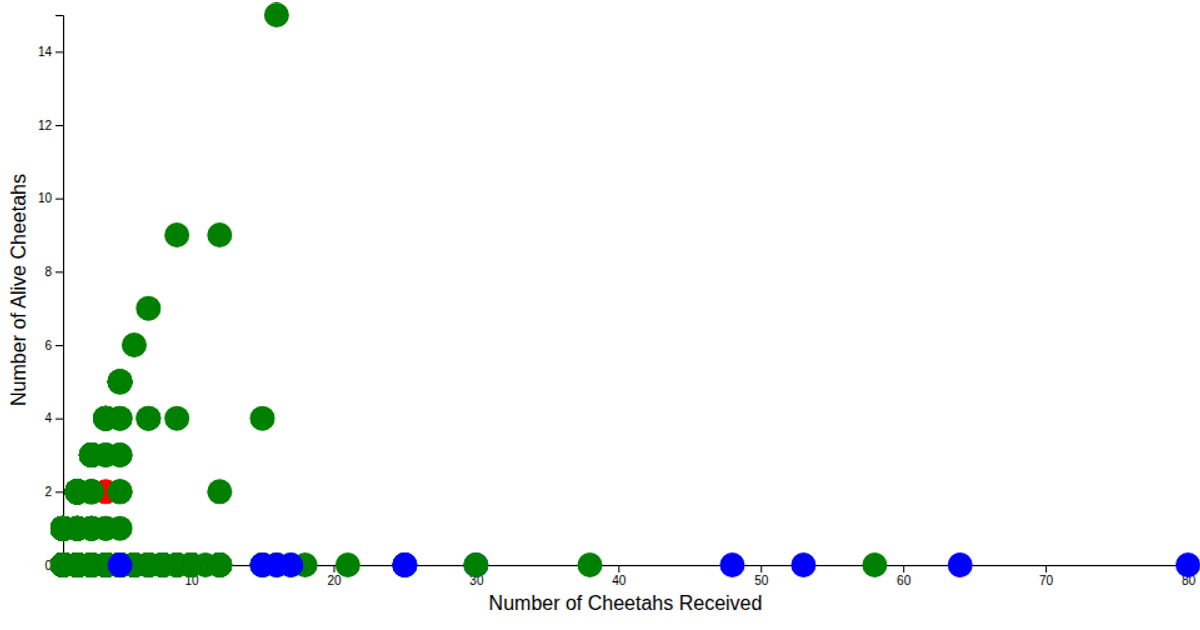
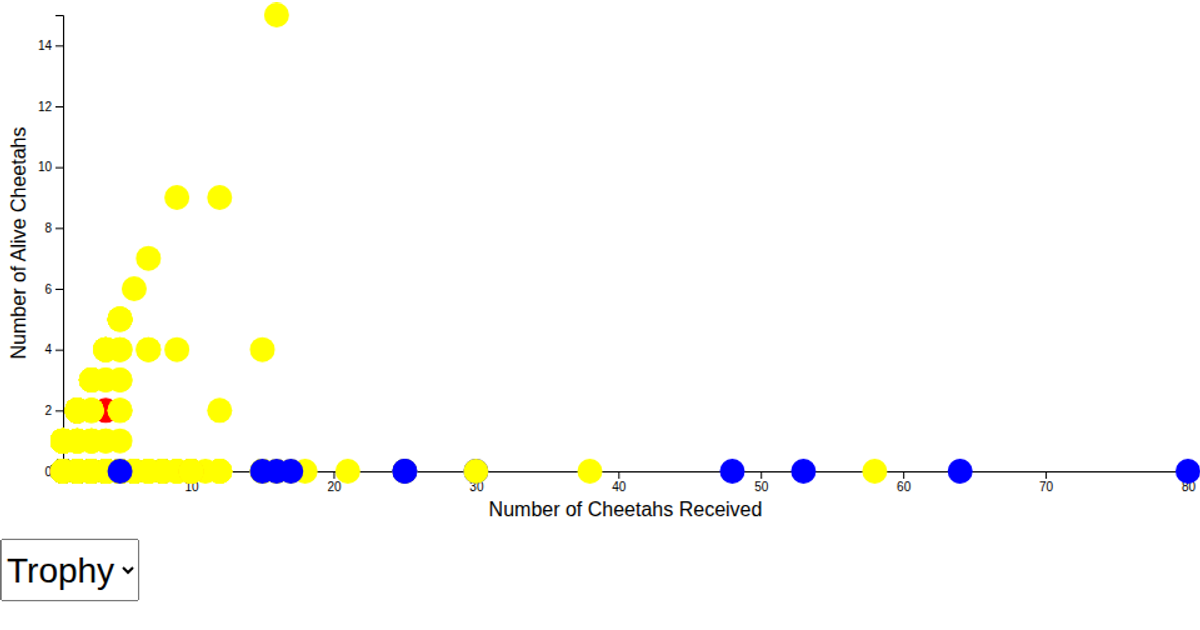
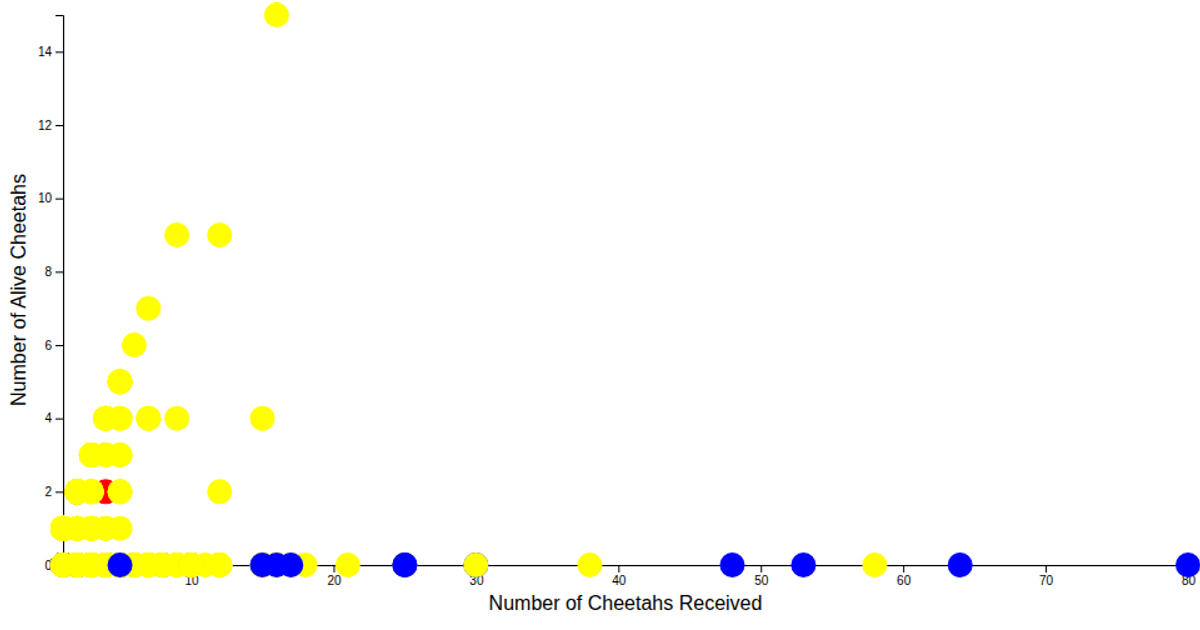
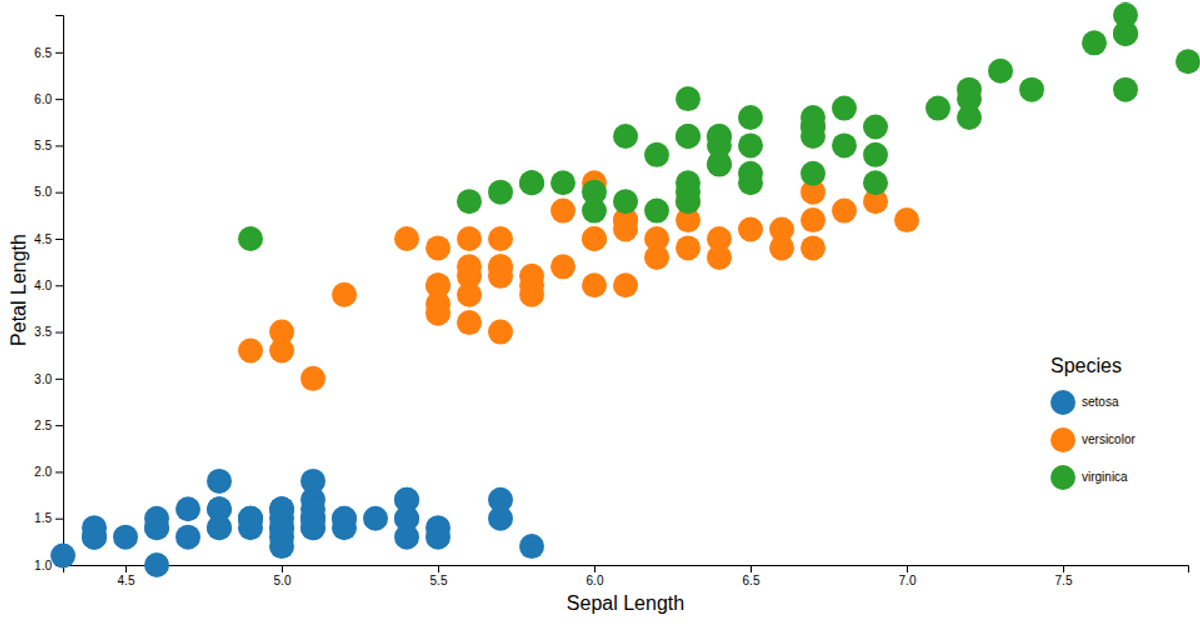
This scatter plot visualizes the Iris Dataset, showing the relationship between the number of cheetahs received and the number alive, with points colored by units via a categorical color legend. Built with D3 v7, it uses `scaleLinear` for axes, `scaleOrdinal` with `schemeCategory10` for coloring, and WebGL rendering. The axes and legend are created through reusable exported functions, while data loads from a CSV file using `csvParse`.
AI-generated descriptionA scatter plot of the Iris Dataset with a color legend.
See also:
MIT Licensed




Comments
Sign in to join the discussion.