🌍 Public
Scatter Plot with Menu Francesca
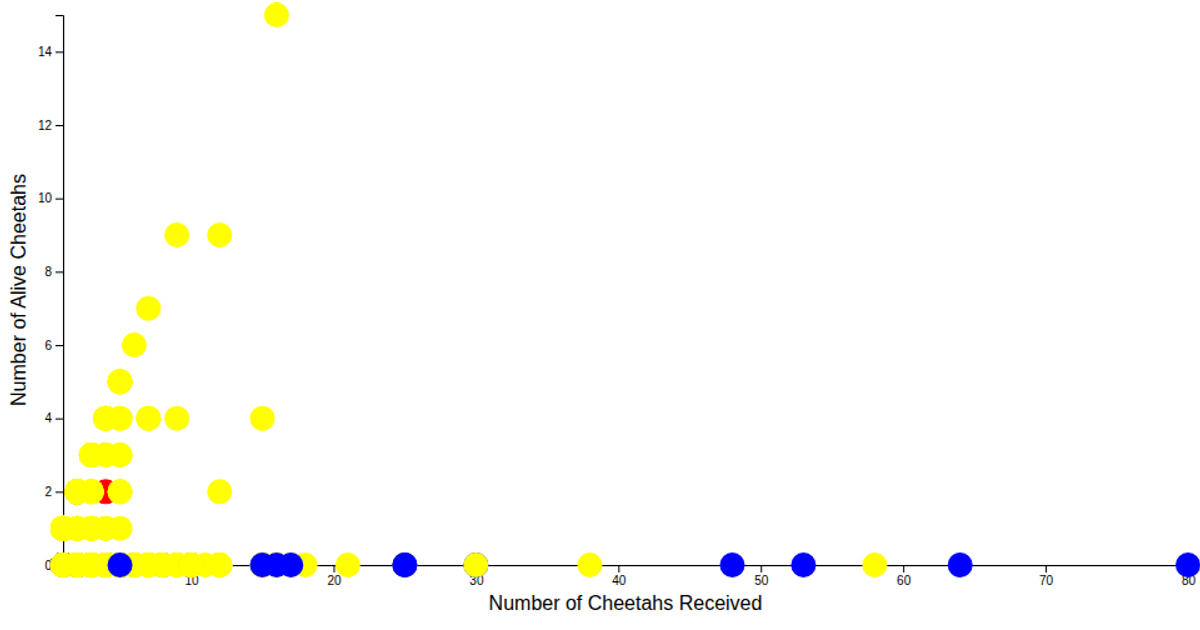
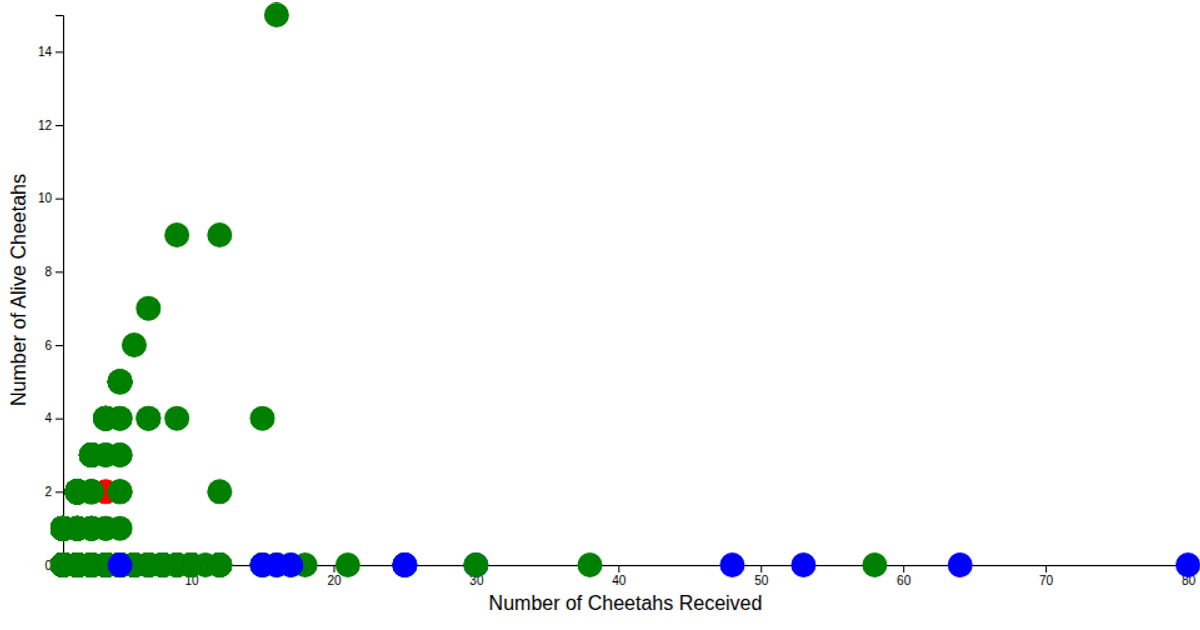
This scatter plot visualizes the Cheetah Dataset, plotting the number of cheetahs received against the number alive, with each point colored by the unit feature (e.g., Live, Skin, Trophy). A dropdown menu allows filtering the color scale’s domain to a specific unit type. Built with D3 v7, it uses `scaleLinear` for axes, `scaleOrdinal` for color mapping, and `csvParse` to load data from a Mendeley-hosted CSV file.
AI-generated descriptionA scatter plot of Cheetah Dataset with axes and color for the unit feature from https://data.mendeley.com/datasets/84k92j4n3y
MIT Licensed




Comments
Sign in to join the discussion.