🌍 Public
Scatter Plot Titles Francesca Sajedi
Ffsajedi22
Last edited Feb 15, 2023
Created on Feb 15, 2023
Forked from Fork of Scatter Plot Simple Francesca Sajedi
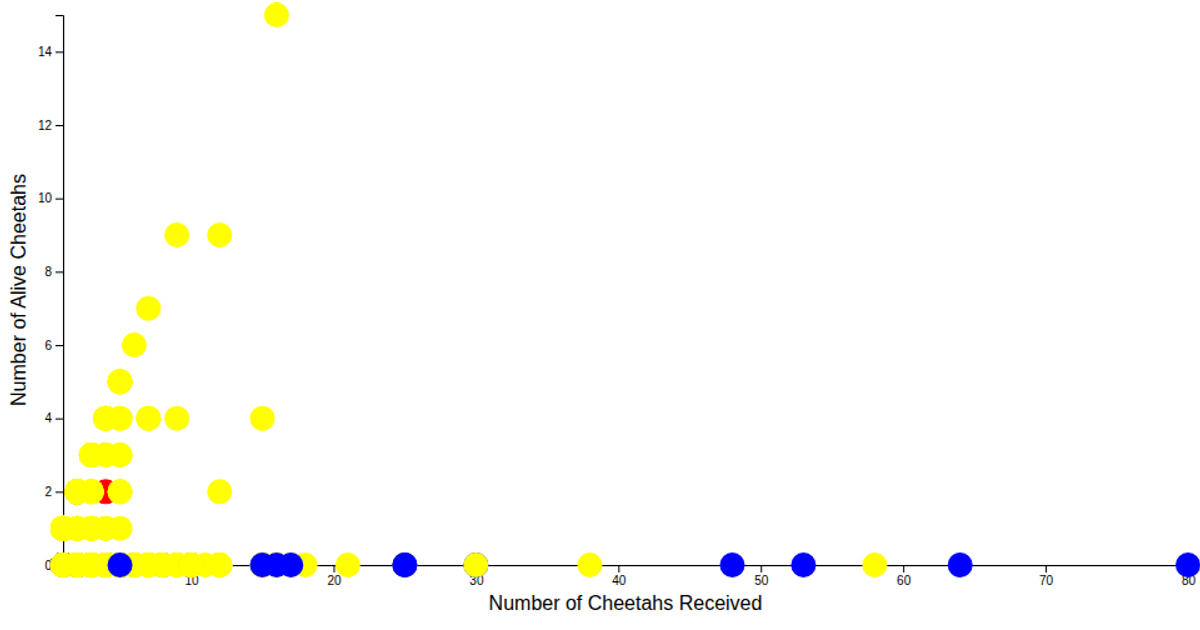
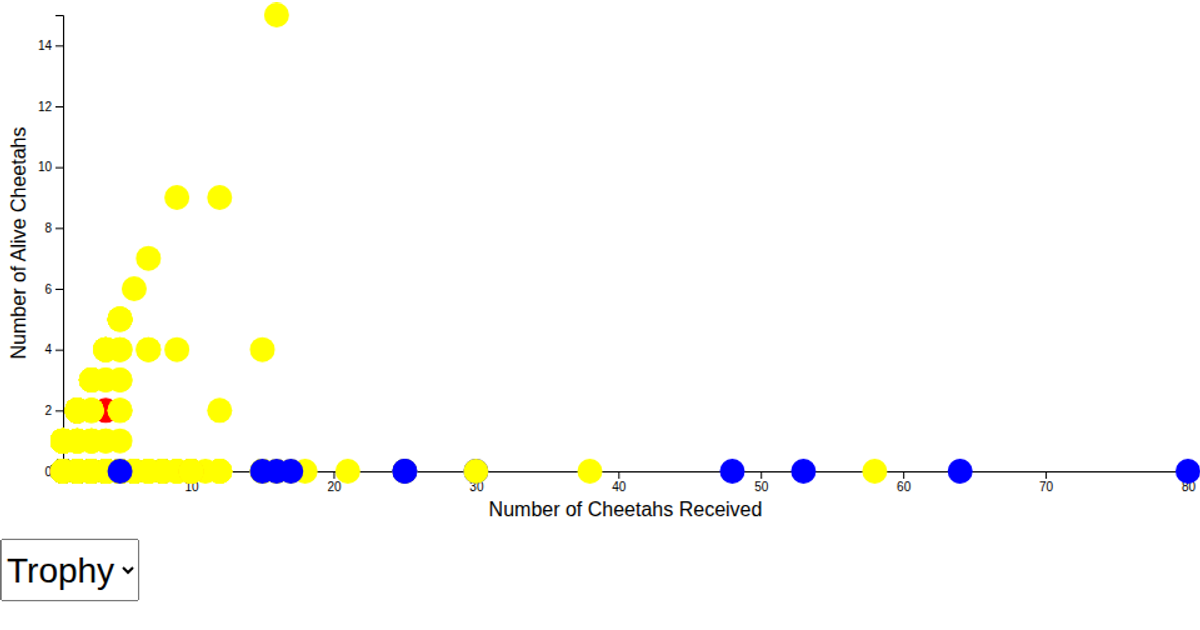
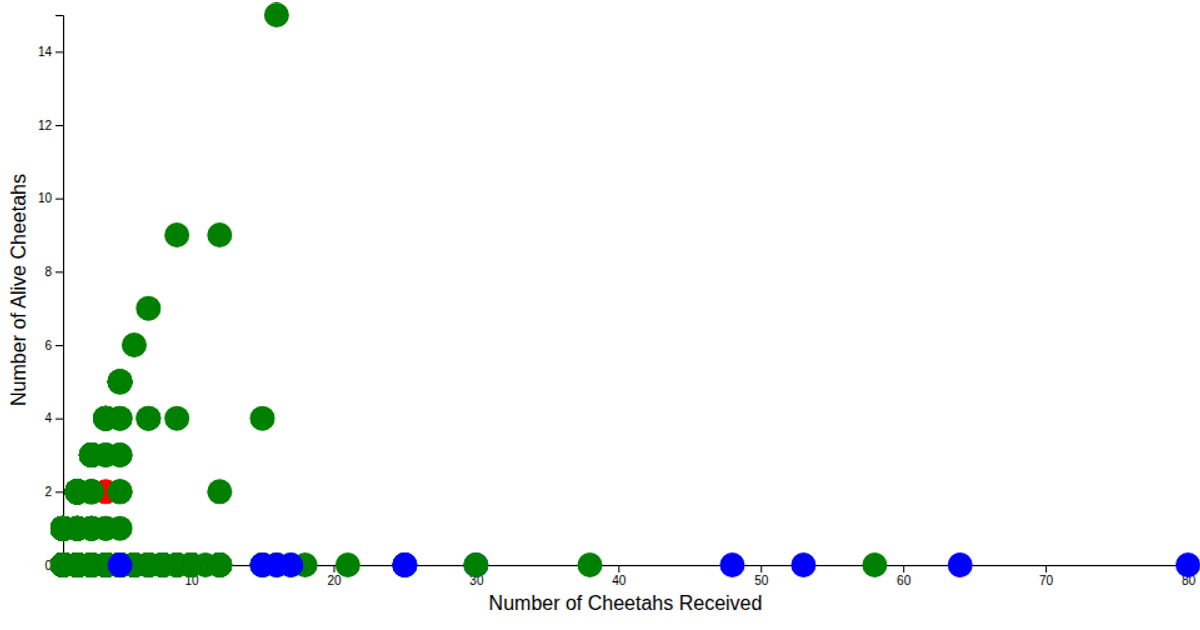
A scatter plot of the Cheetah Dataset from Mendeley visualizes the relationship between the number of cheetahs in incidents and the count recorded as alive. The plot displays data points without axes, using D3 v7 with WebGL rendering. It loads CSV data via `csvParse`, scales values with `scaleLinear` and `extent`, and renders circles positioned by `xScale` and `yScale`. The custom `axes` module imports `axisLeft` and `axisBottom` but does not apply them in the final visualization.
AI-generated descriptionA scatter plot of Cheetah Dataset with no axes from https://data.mendeley.com/datasets/84k92j4n3y
MIT Licensed



Comments
Sign in to join the discussion.