Victory!
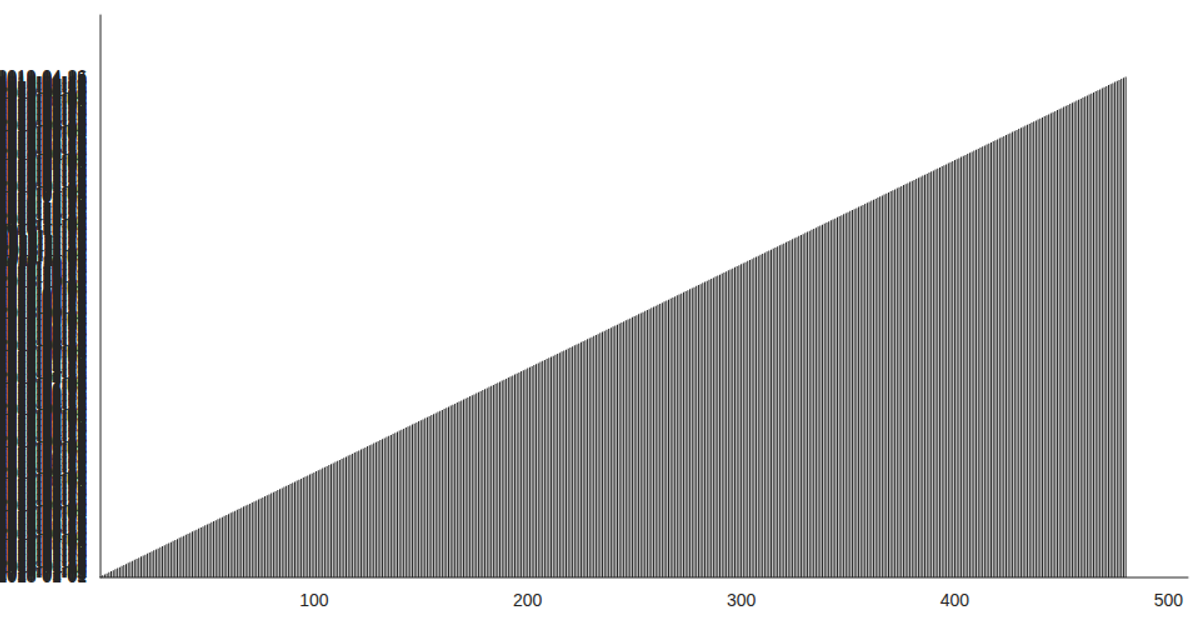
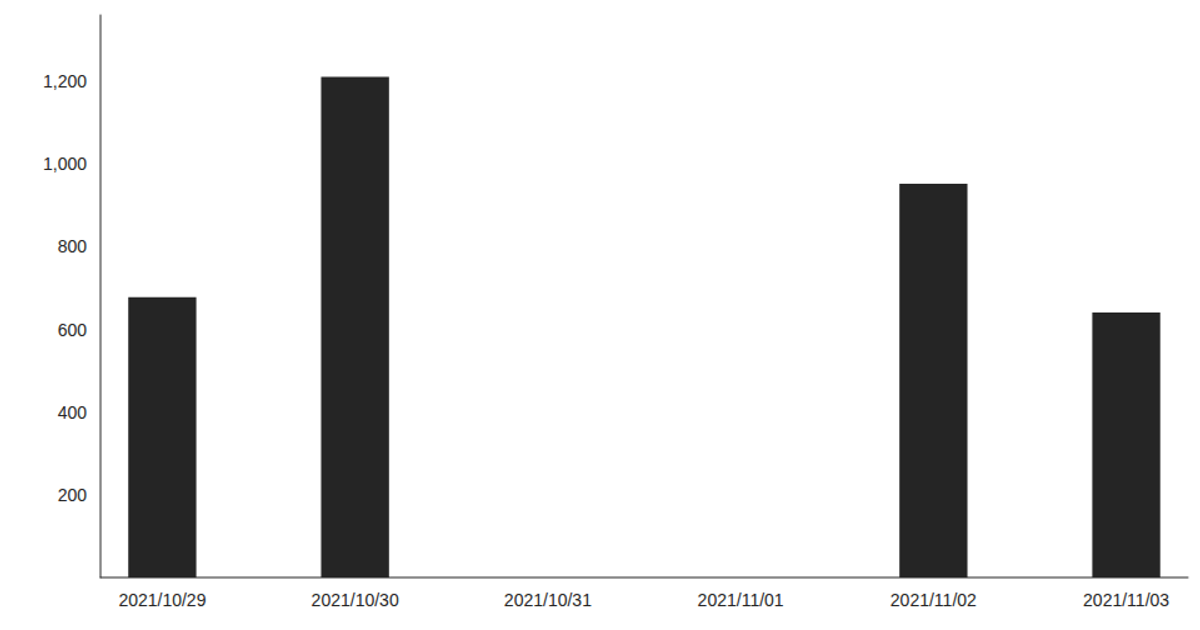
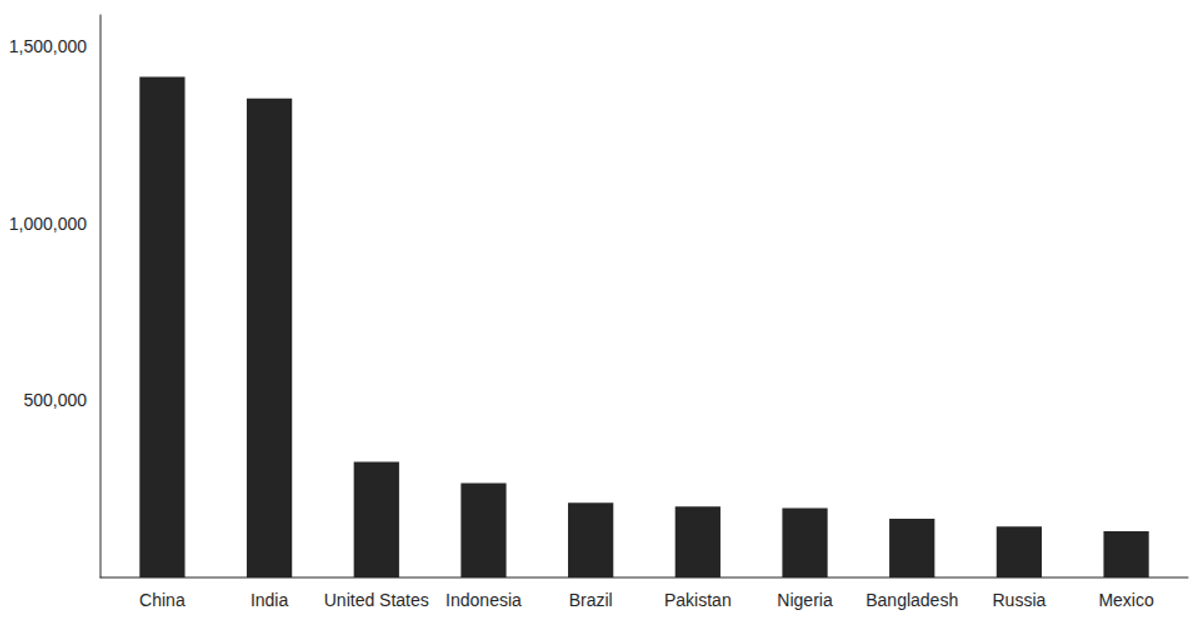
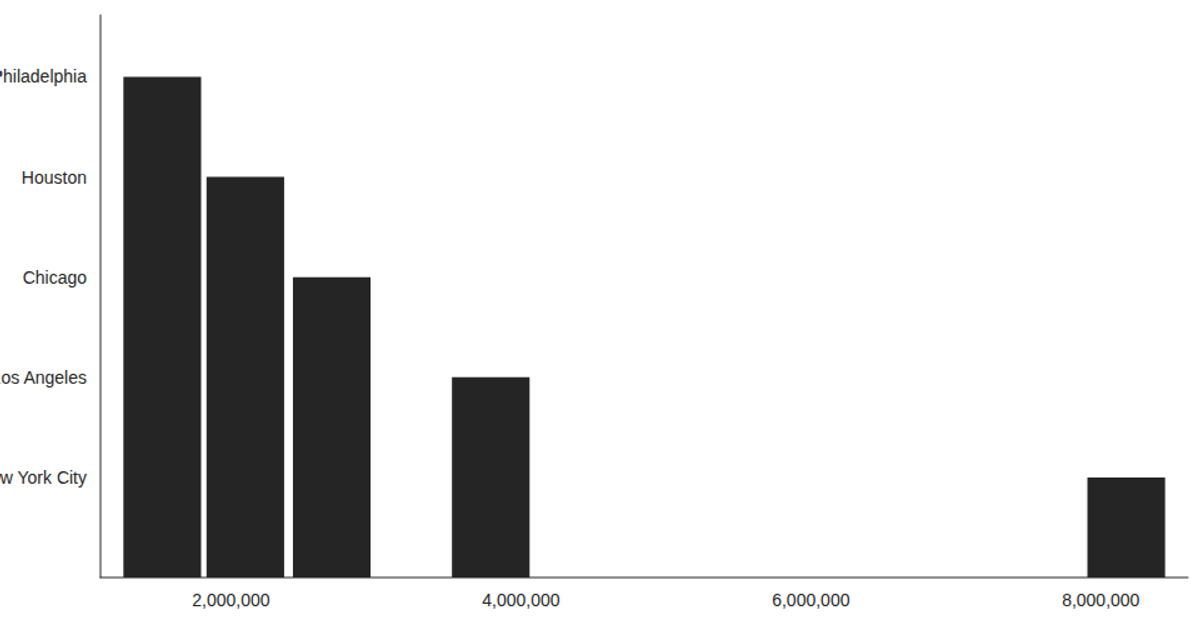
This example visualizes daily app installs across Alaskan cities in December 2019, plotting each date’s install count as a bar using Victory’s `<VictoryBar>` and `<VictoryChart>` components. The code loads data from a CSV via the `csv` function from `d3` and parses numeric fields with a row-accessor callback. It uses React hooks (`useState`, `useEffect`) to fetch and store the data, then renders a responsive chart with custom padding and tick-label styling. The visualization clearly shows daily fluctuations in installs, with Anchorage and Fairbanks appearing most frequently.
AI-generated descriptionThis example shows how to load data from a CSV file using React hooks and visualize the result using Victory Charts. Inspired by this Victory example from Swizec Teller in React for Data Visualization.



Comments
Sign in to join the discussion.