🌍 Public
Fork of Working Region Filter
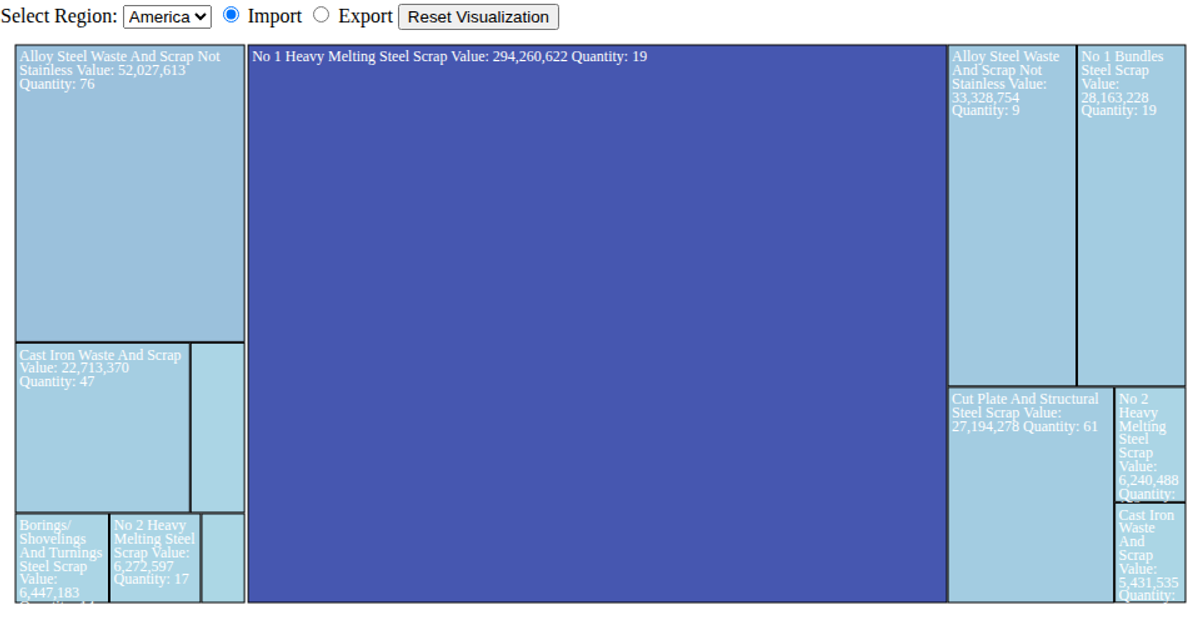
This interactive treemap visualizes US steel scrap trade data, showing the relative monetary value of imports and exports by partner country within a selected region. Users can filter the view by region and toggle between import and export flows. The visualization uses a hierarchical treemap layout, rendered as SVG, with color intensity reflecting magnitude. Built with D3 v7, the code leverages `d3.hierarchy` and `d3.treemap` to structure and compute rectangle positions, while `d3.scaleSequential` drives the color mapping. Clicking a country cell initiates a drill-down, suggesting further exploration of commodity-level details.
AI-generated descriptionMIT Licensed






Comments
Sign in to join the discussion.