🌍 Public
Region Filter
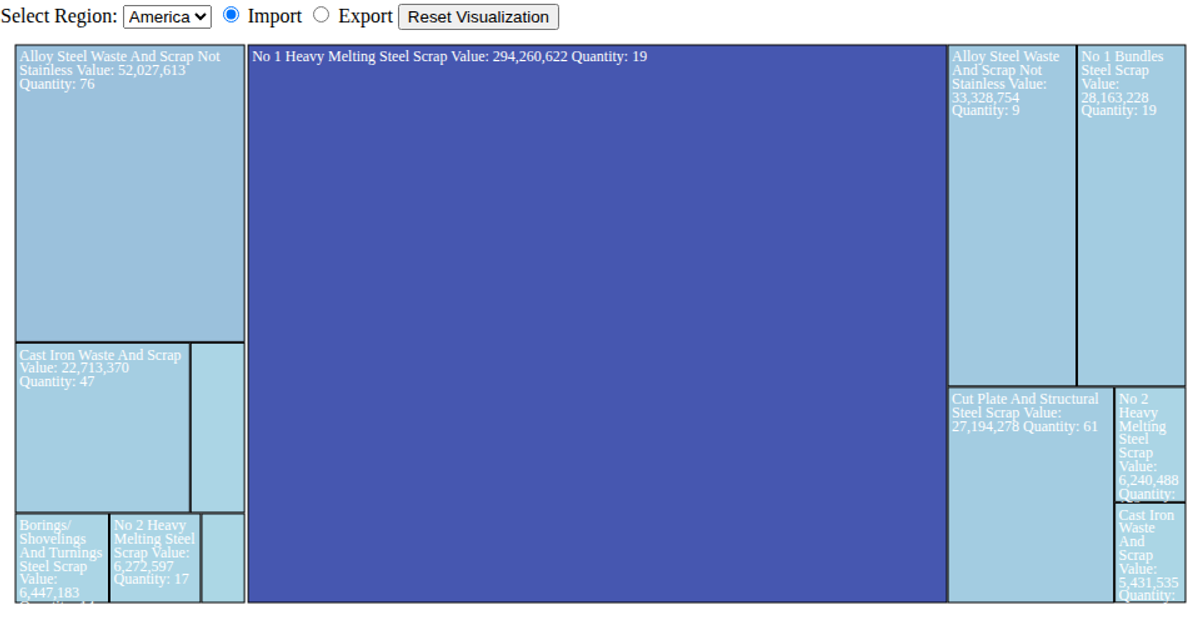
This interactive treemap visualizes steel scrap trade values between the United States and its partner countries, filtered by import or export direction. Users can toggle between these flows and select a specific region, which aggregates data by partner country using d3.hierarchy from the CSV dataset. The visualization uses d3.treemap to layout cells, with a sequential color scale mapping value magnitude from lightblue to darkblue. Clicking a country cell drills down to reveal commodity-level details, while the reset button restores the aggregated country view.
AI-generated descriptionMIT Licensed




Comments
Sign in to join the discussion.