🌍 Public
Quantity added to the visuals and
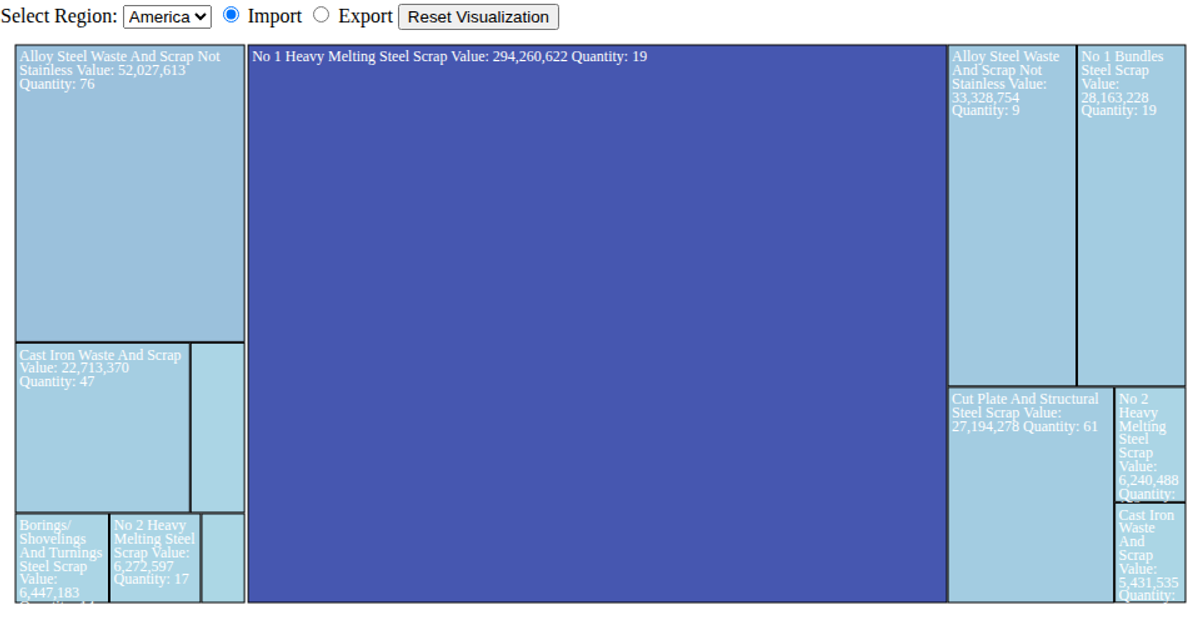
This visualization uses a treemap to show the value and quantity of steel scrap imports and exports between regions and partner countries. Users can filter by region and toggle between import/export data. Built with D3 v7, it uses `d3.treemap` and `d3.hierarchy` to layout hierarchical data, with cell color scaled via `d3.scaleSequential` and `d3.interpolateRgb`. Interactive drill-down reveals nested commodity details on click. Data comes from a CSV file.
AI-generated descriptionMIT Licensed


Comments
Sign in to join the discussion.