🌍 Public
Fork of Custom Color TreeMap
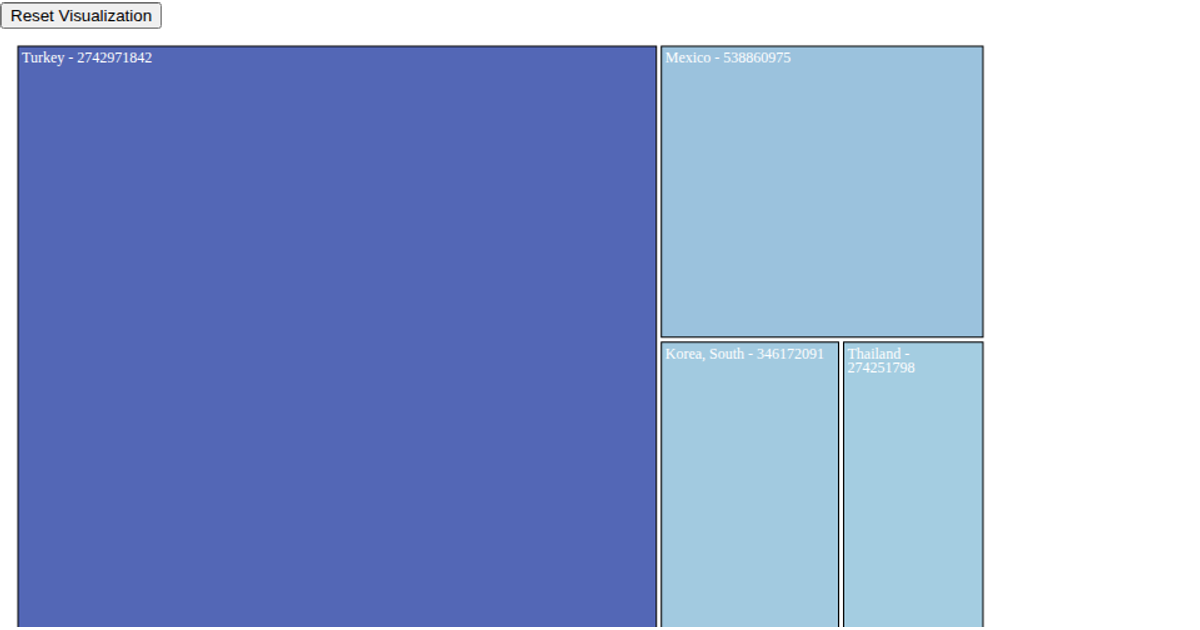
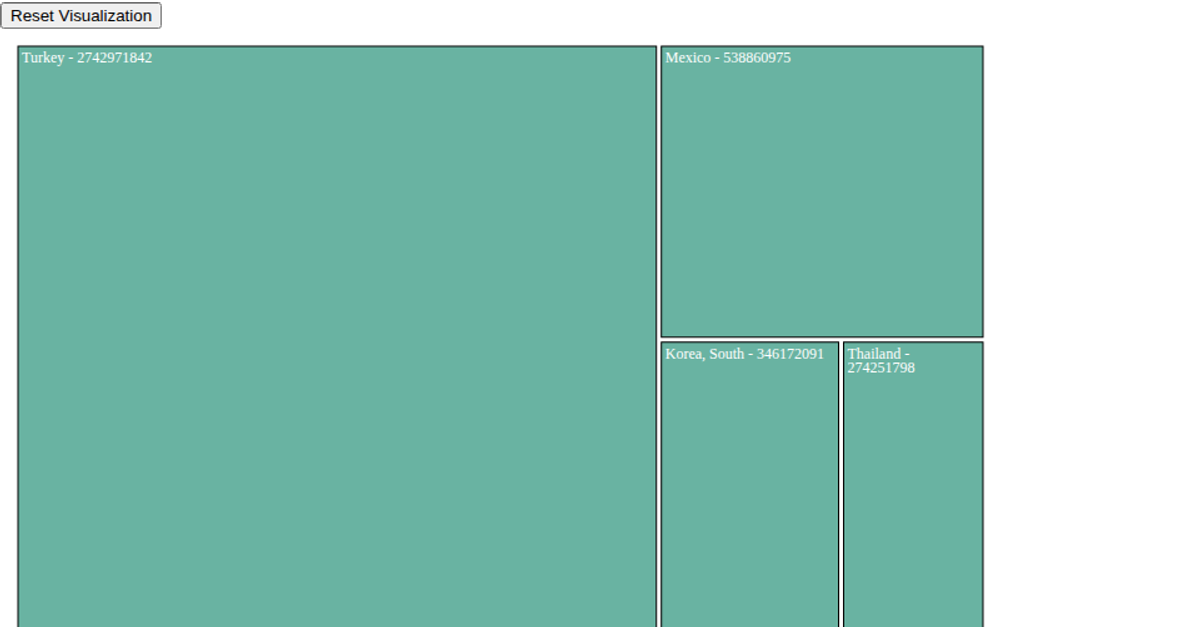
This interactive treemap visualizes steel scrap exports from the United States to various partner countries, with each colored rectangle representing a country and its total export value. The visualization uses d3.hierarchy and d3.treemap to compute the layout, with a sequential color scale interpolating from lightblue to darkblue based on value magnitude. Users can click any country cell to drill down into its commodity-level breakdown, while a reset button restores the original country-level view. The code employs D3 v7's data joins and transition methods to smoothly animate between hierarchy levels, with SVG rendering for all elements.
AI-generated descriptionMIT Licensed





Comments
Sign in to join the discussion.