🌍 Public
Fork of Prototype v5
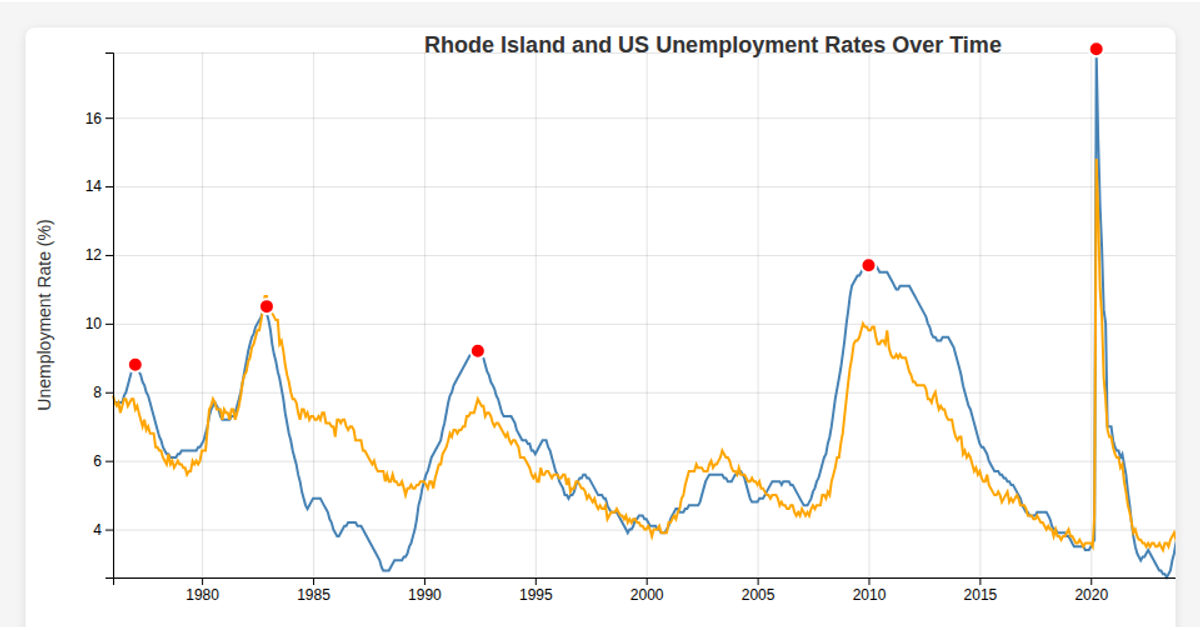
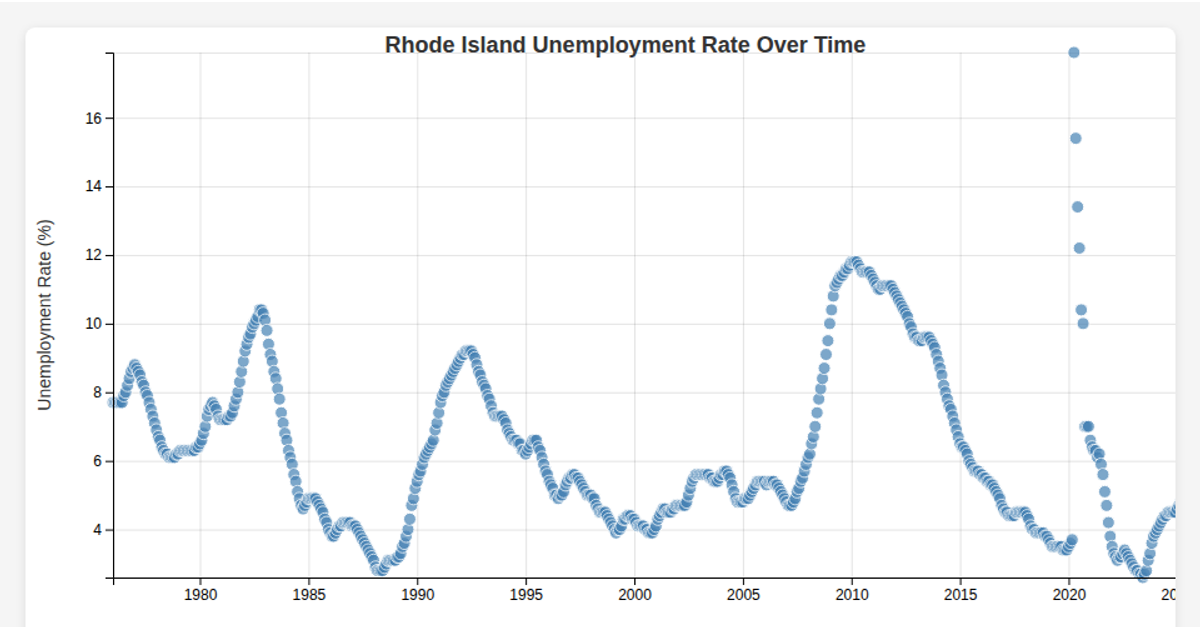
This fork of Prototype v5 presents two stacked time-series line charts comparing the unemployment insurance rates of Rhode Island (RIUR) and the United States (USUIR) from 1976 onward. Built with React and D3 v7, it loads both datasets via `d3.csv` and parses dates with `d3.timeParse`. A custom `viz` function renders each chart using `d3.scaleTime`, `d3.scaleLinear`, and `d3.line`. Interactive hover features, managed through React state and D3's `select` API, display a crosshair and tooltip showing the exact date and both rates.
AI-generated descriptionMIT Licensed





Comments
Sign in to join the discussion.