🌍 Public
Prototype v4
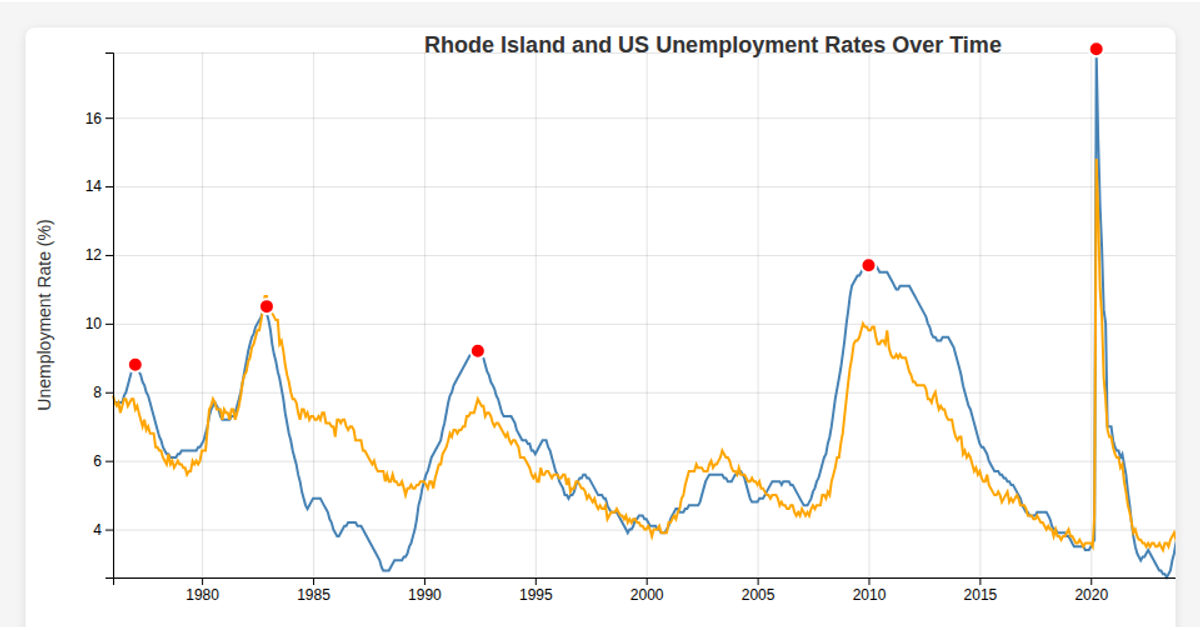
This visualization shows Rhode Island's monthly unemployment rate (RIUR) from 1976 onward, highlighting historical spikes with red dots overlaid on a steelblue line chart. The React app loads data from a CSV file using d3.csv, parses dates with d3.timeParse, and renders the chart through d3.scaleTime, d3.scaleLinear, d3.line, d3.axisBottom, d3.axisLeft, and d3.extent functions. A legend distinguishes the line series from annotated spike points.
AI-generated descriptionMIT Licensed




Comments
Sign in to join the discussion.