🌍 Public
Prototype v3
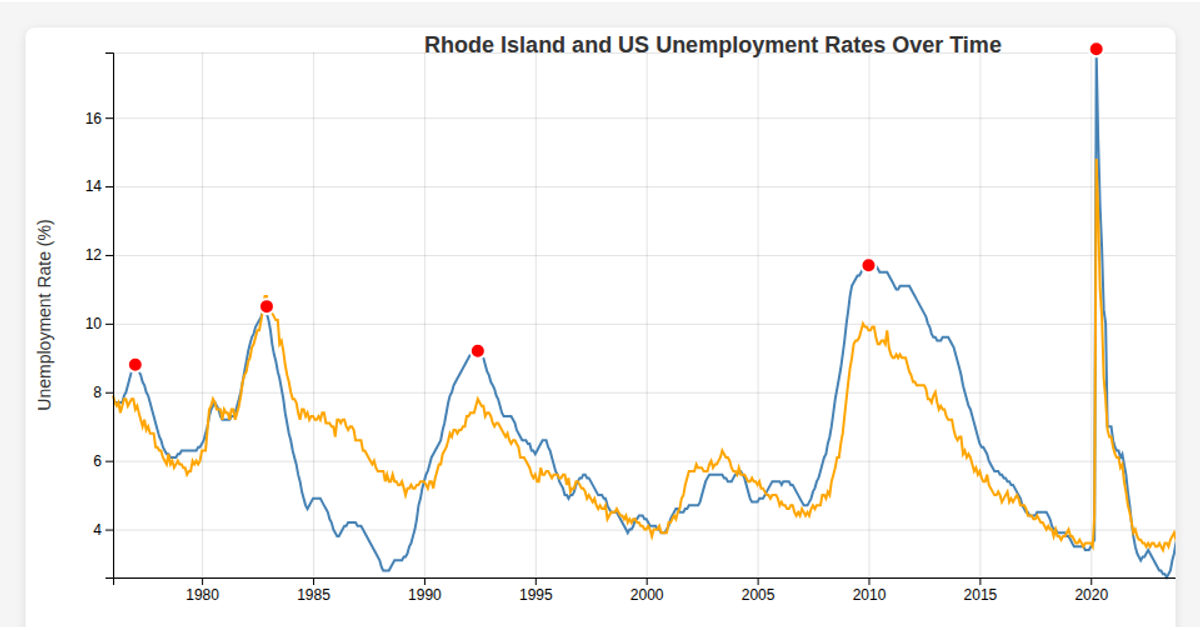
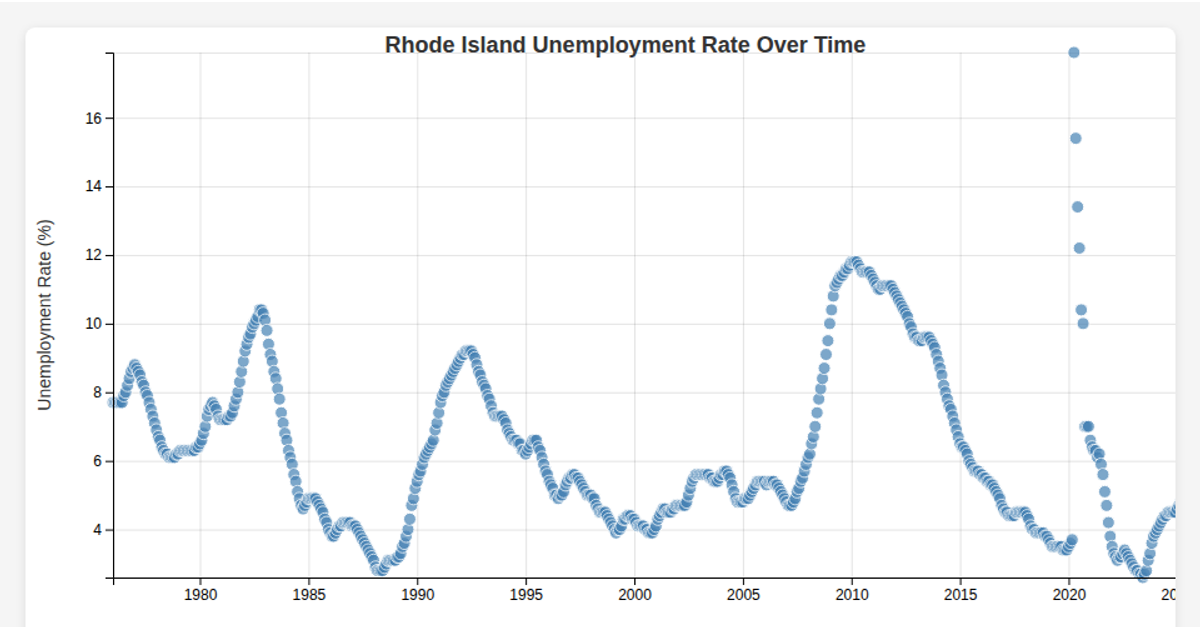
A line chart visualizes Rhode Island's unemployment rate from 1976 to 2020, revealing cyclical spikes marked by red dots during economic downturns. Hovering over the chart displays a tooltip with the precise date and rate at the nearest data point. The visualization uses React with D3 v7, employing `d3.csv` for data loading, `d3.scaleTime`/`d3.scaleLinear` for axes, and custom bisection logic for interactivity.
AI-generated descriptionMIT Licensed




Comments
Sign in to join the discussion.