🌍 Public
Prototype v1
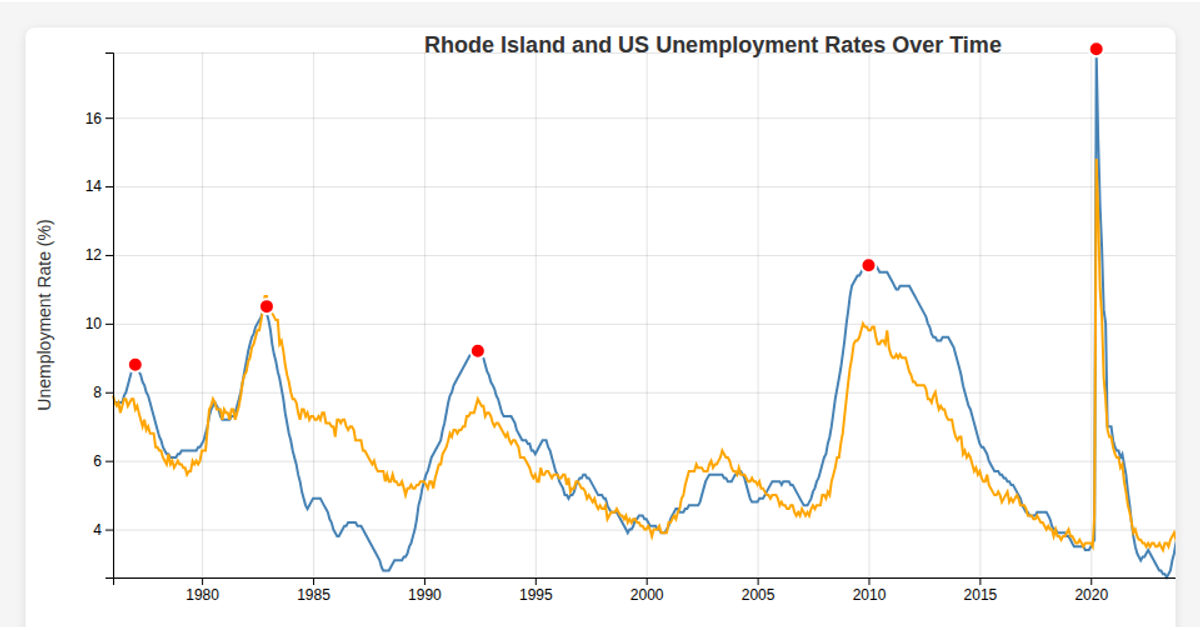
This visualization displays Rhode Island’s monthly unemployment rate from 1976 onward, revealing cyclical peaks and troughs over time. Built with React and D3 v7, the app loads a CSV file, parses dates, and renders a line chart using scales, axes, and a line generator. Grid lines and labeled axes clarify the trend, with the data sourced from a local data.csv file.
AI-generated descriptionMIT Licensed




Comments
Sign in to join the discussion.