🌍 Public
Circle on the Map3
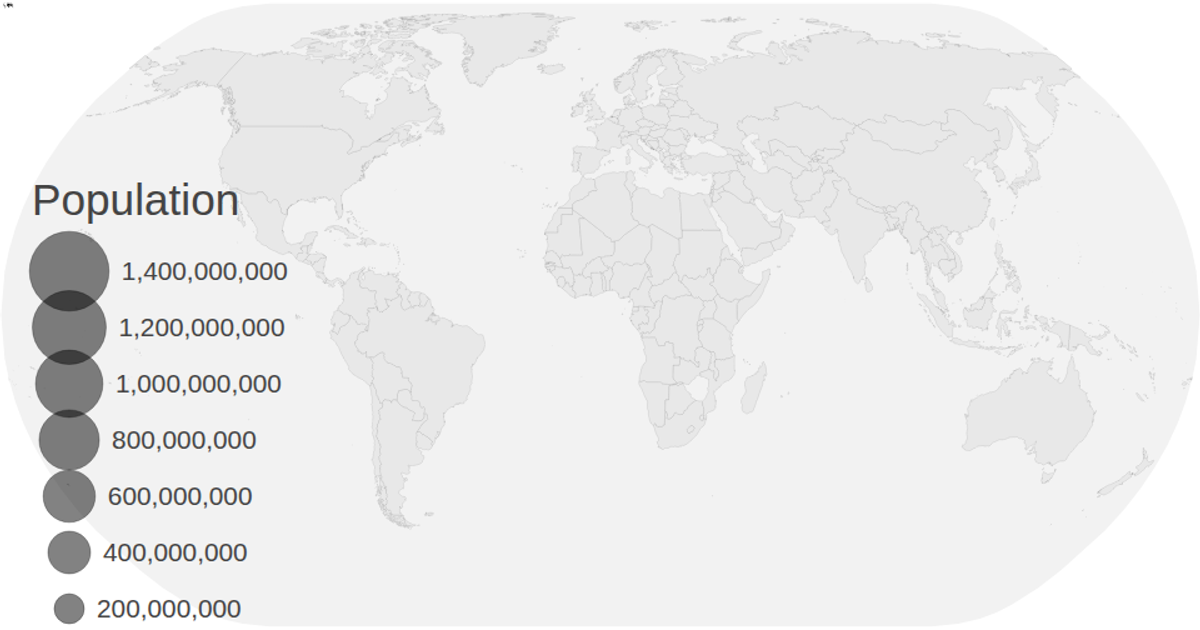
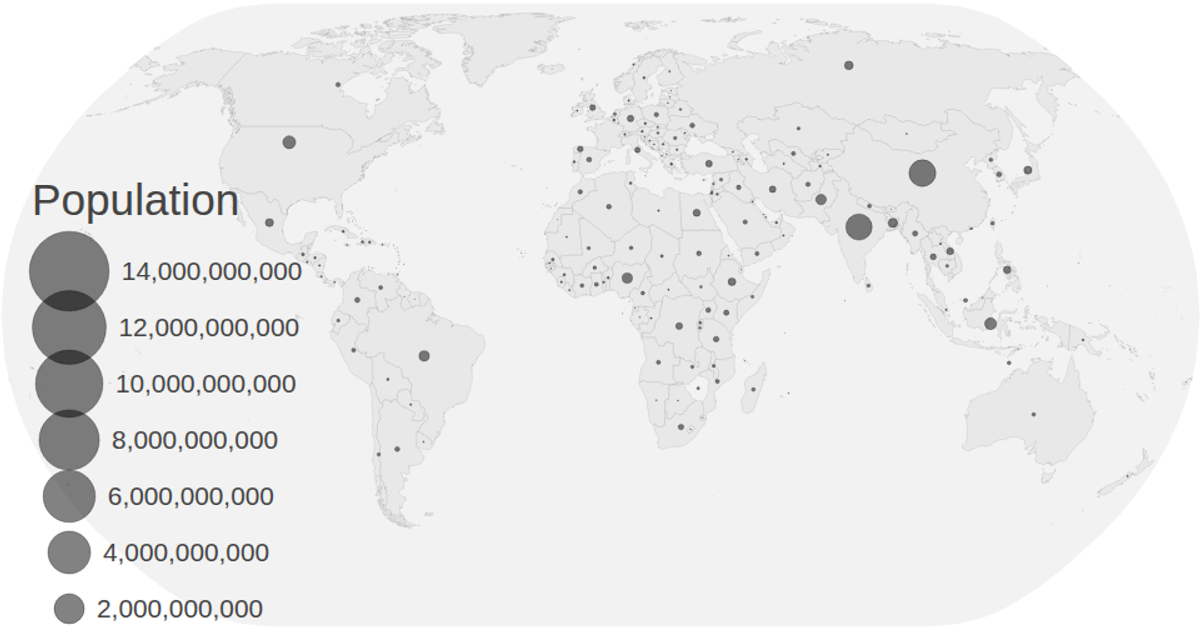
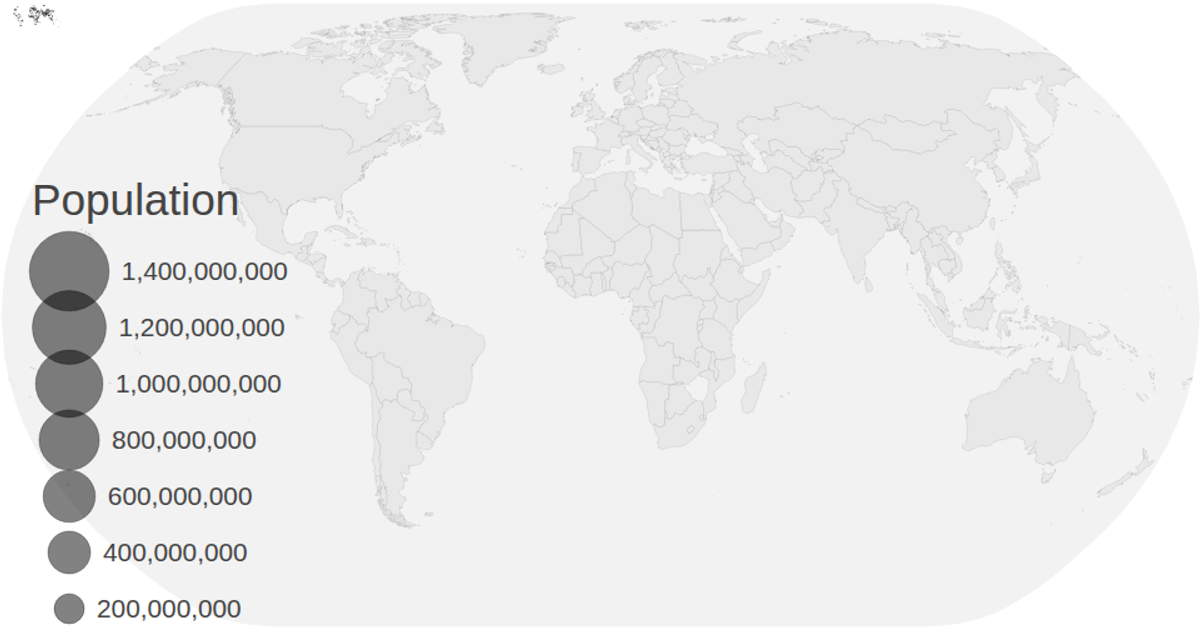
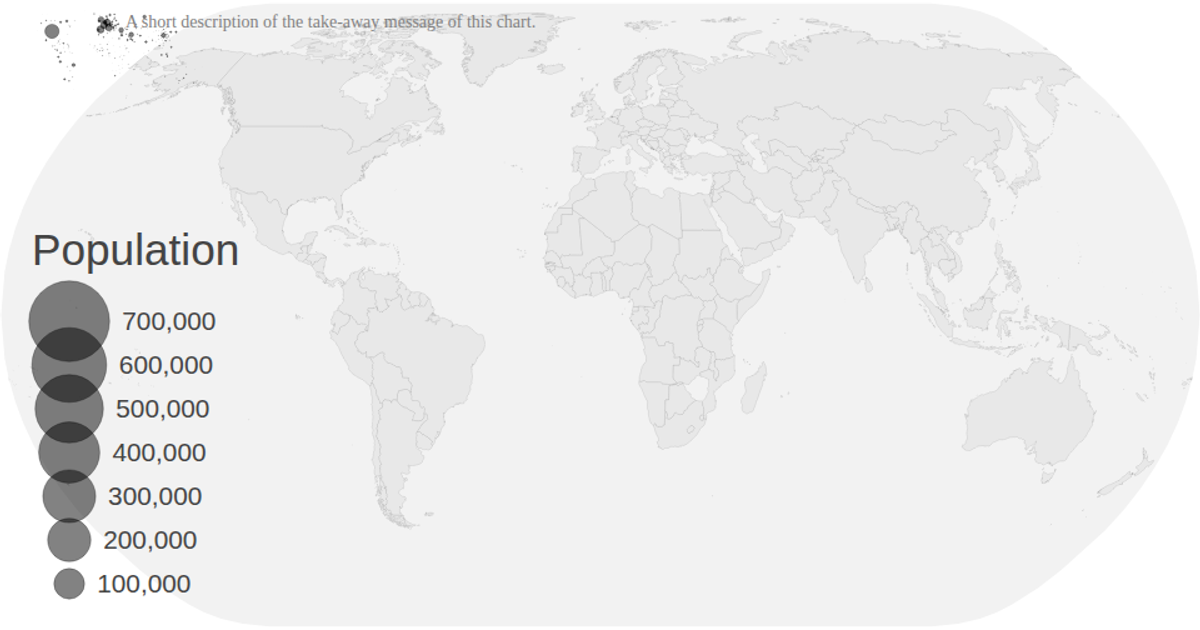
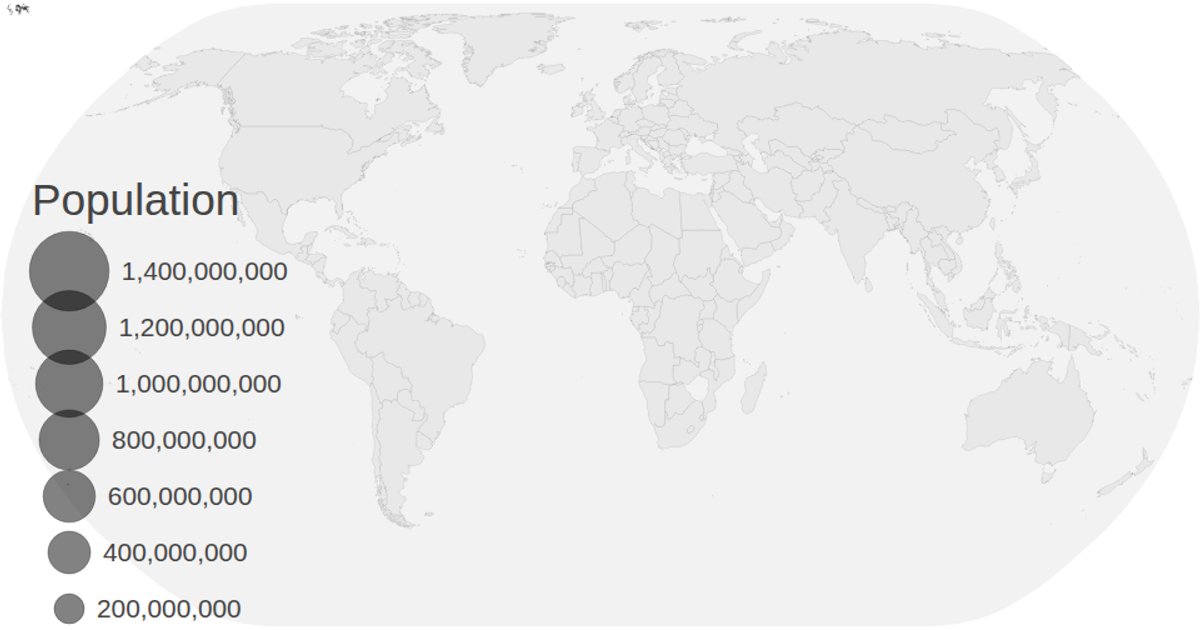
This visualization displays population projection data on a world map over time, with animated circles representing values for each country from 2020 to 2030. The map is rendered using d3.geoNaturalEarth1 and d3.geoPath, while circle radii are scaled with d3.scaleSqrt. The animation cycles through decades sequentially, updating the displayed year and circle sizes via d3.transition. Data comes from CSV files with country coordinates and population estimates, and the visualization includes interactive zoom functionality through d3.zoom.
AI-generated descriptionMIT Licensed



Comments
Sign in to join the discussion.