🌍 Public
Circle on the Map
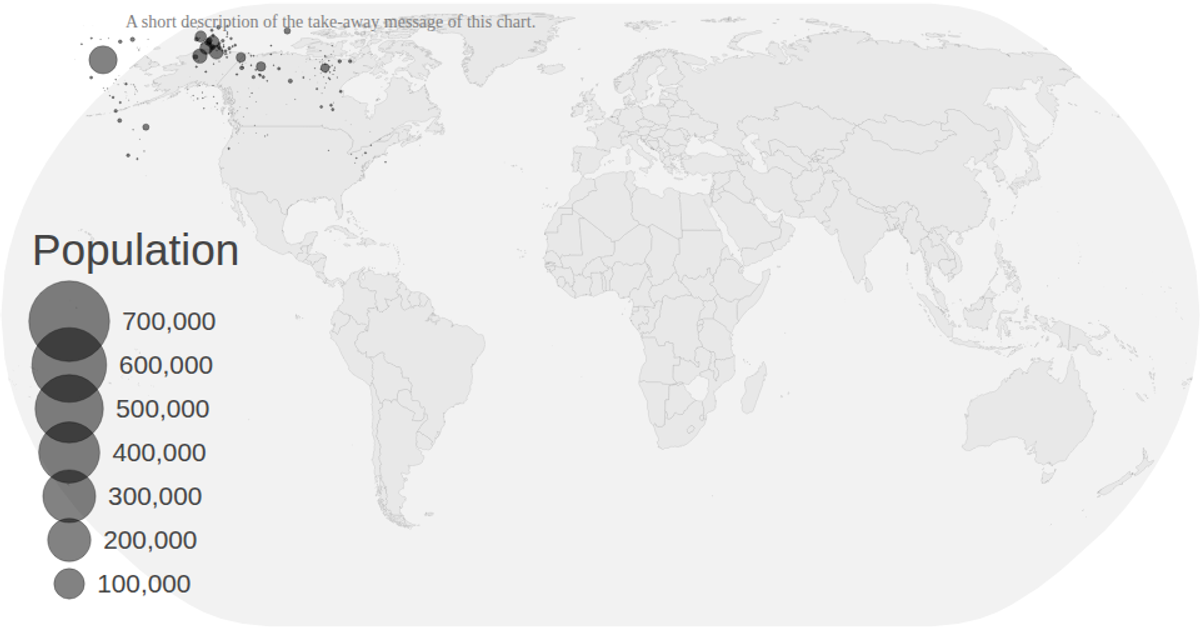
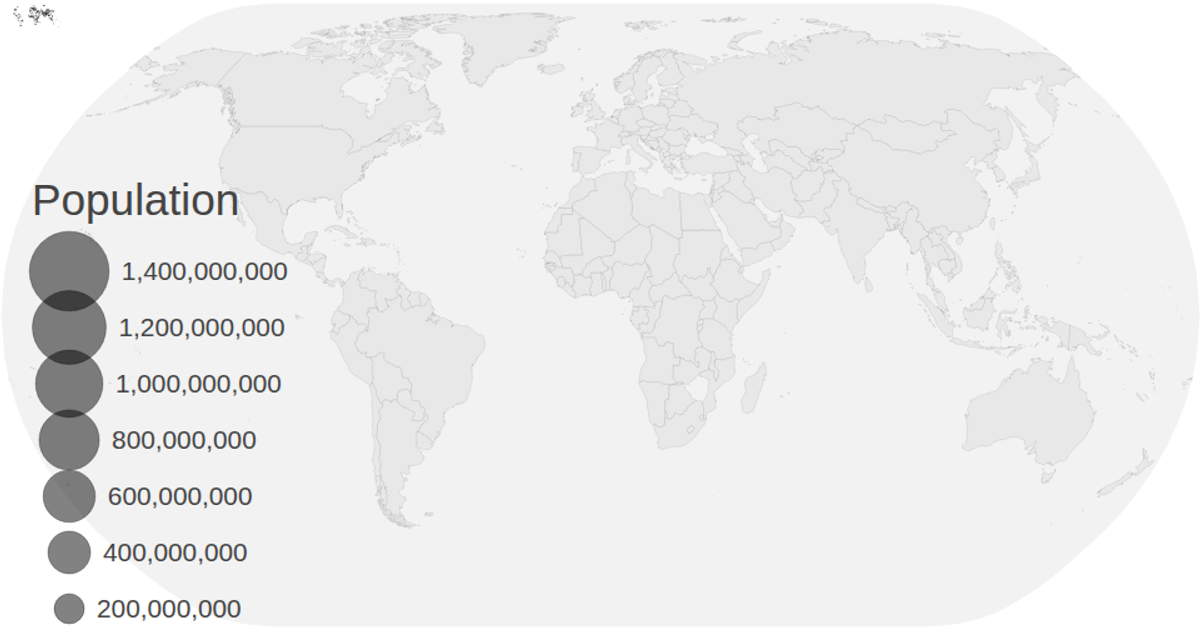
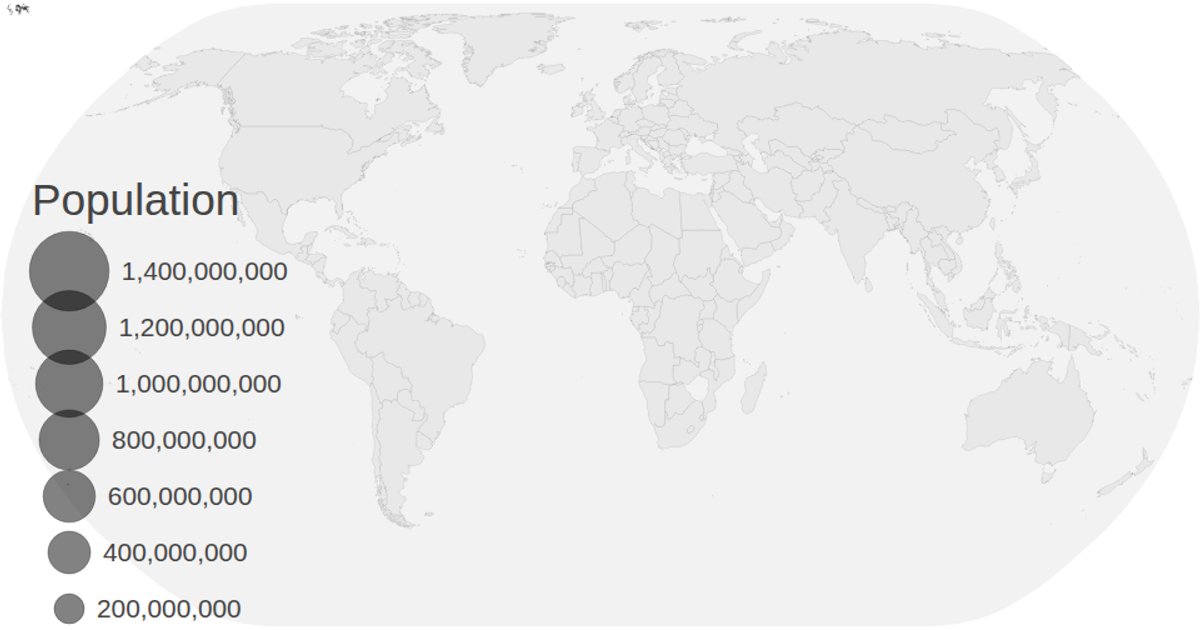
This visualization animates population projections for countries from 2020 to 2030, using circles positioned at geographic centroids on a natural Earth projection. Circle radius encodes population magnitude via a square-root scale, with a color legend distinguishing regions and a size legend showing population values. The map loads TopoJSON world data and CSV population data, rendering countries as SVG paths and animating circles through sequential transitions with delays. The code uses d3.geoPath, d3.geoCentroid, d3.zoom, and transition methods to create the dynamic overlay.
AI-generated descriptionMIT Licensed


Comments
Sign in to join the discussion.