🌍 Public
Circle on the Map
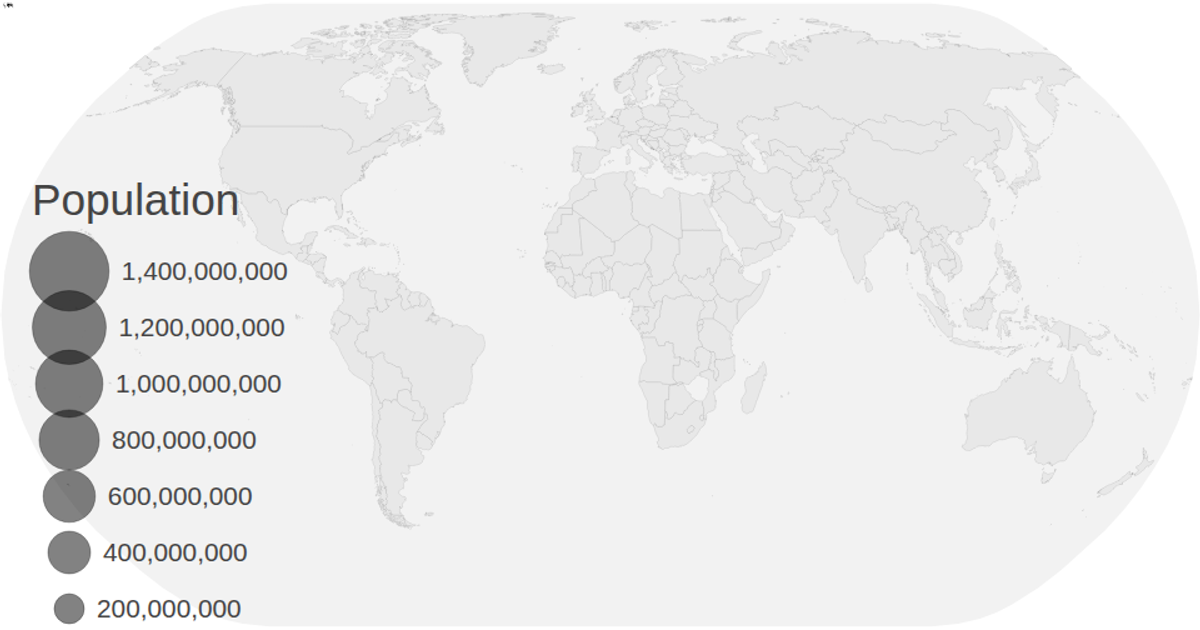
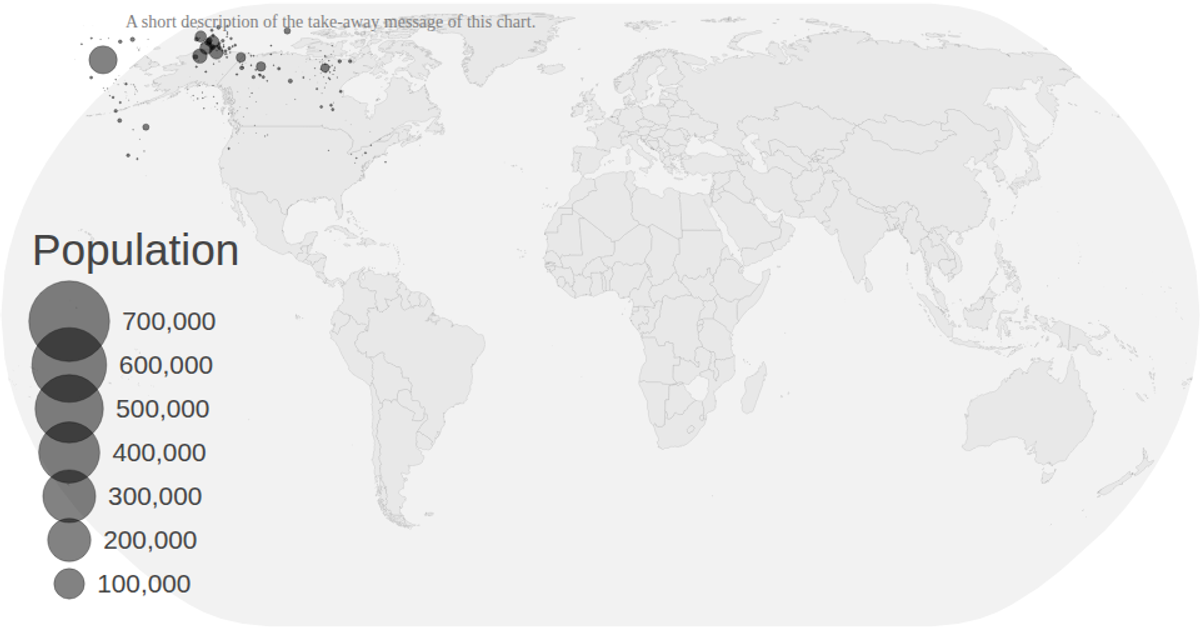
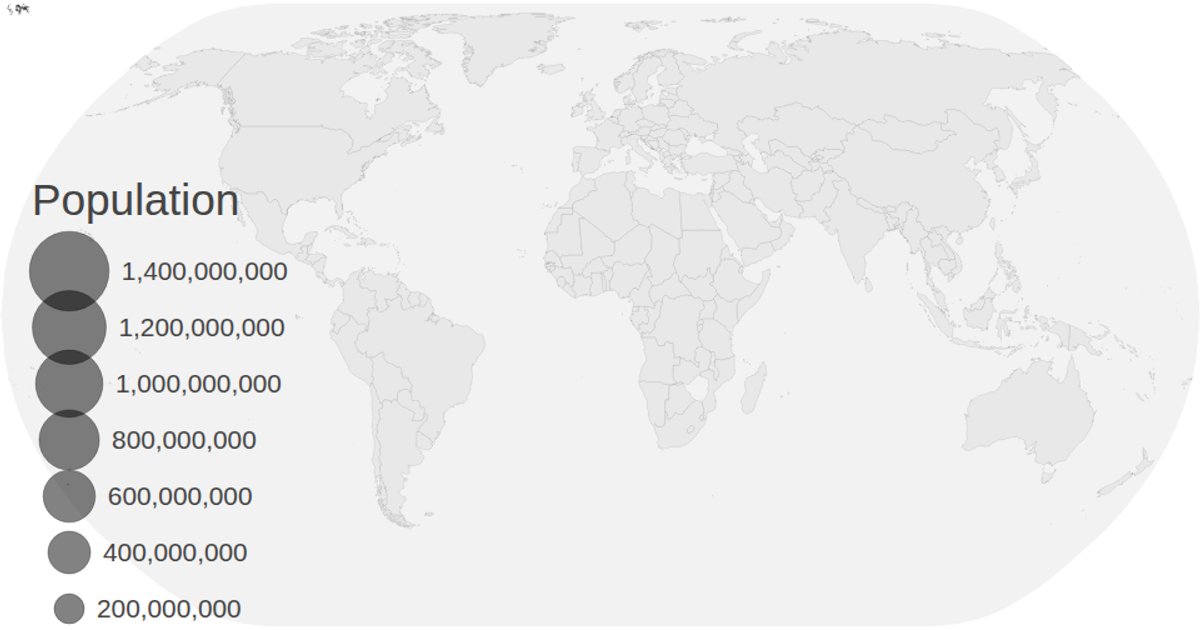
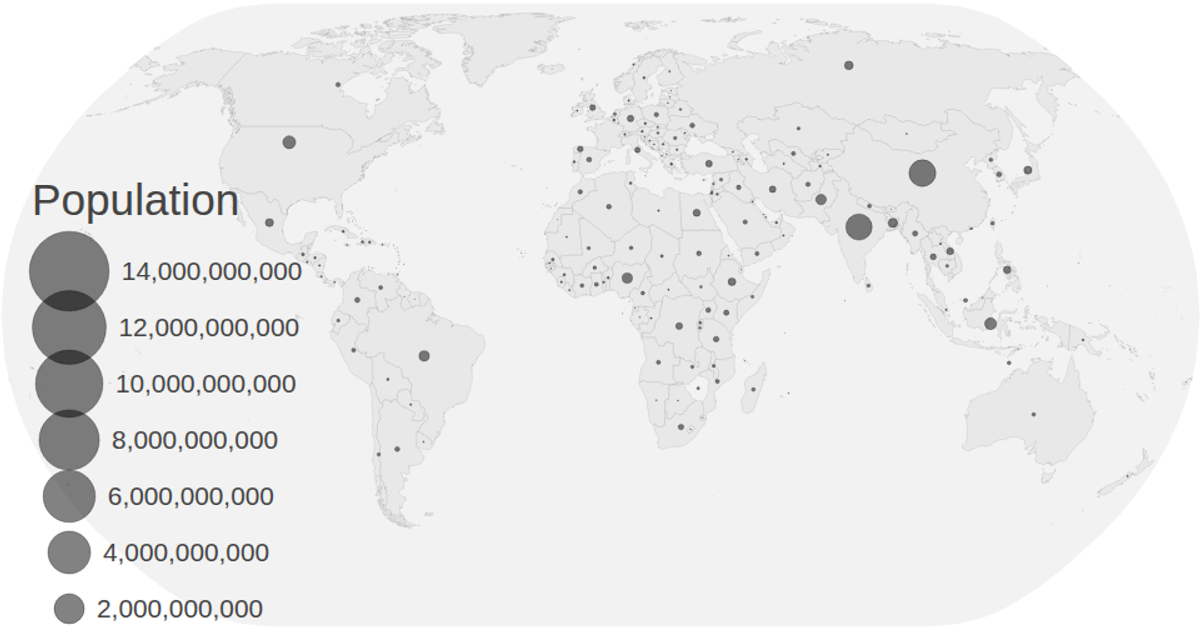
This interactive map visualizes projected population changes from 2020 through 2030, with circles sized by population using a square-root scale. The visualization animates growth by iterating through years, transitioning circle radii with `transition.delay` and `transition.duration`. It uses D3 v5 with `geoNaturalEarth1` projection, `geoPath`, and TopoJSON world data merged with UN population CSV data, offering zoom via `d3.zoom` and a legend showing population values.
AI-generated descriptionMIT Licensed




Comments
Sign in to join the discussion.