🌍 Public
Fork of Circle on the Map3
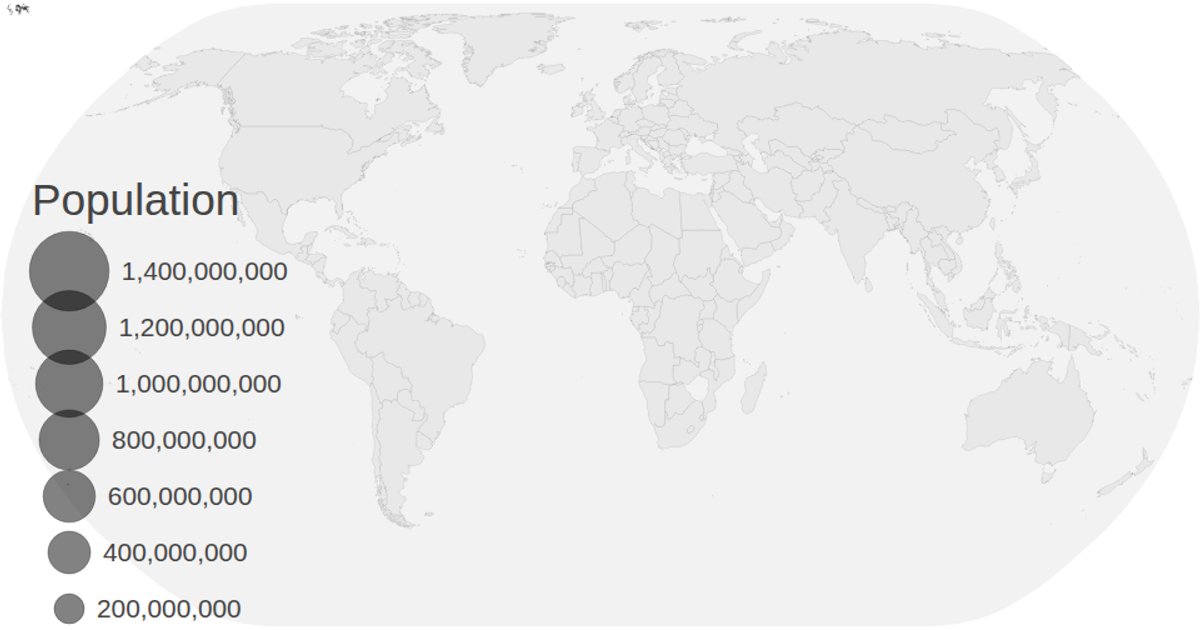
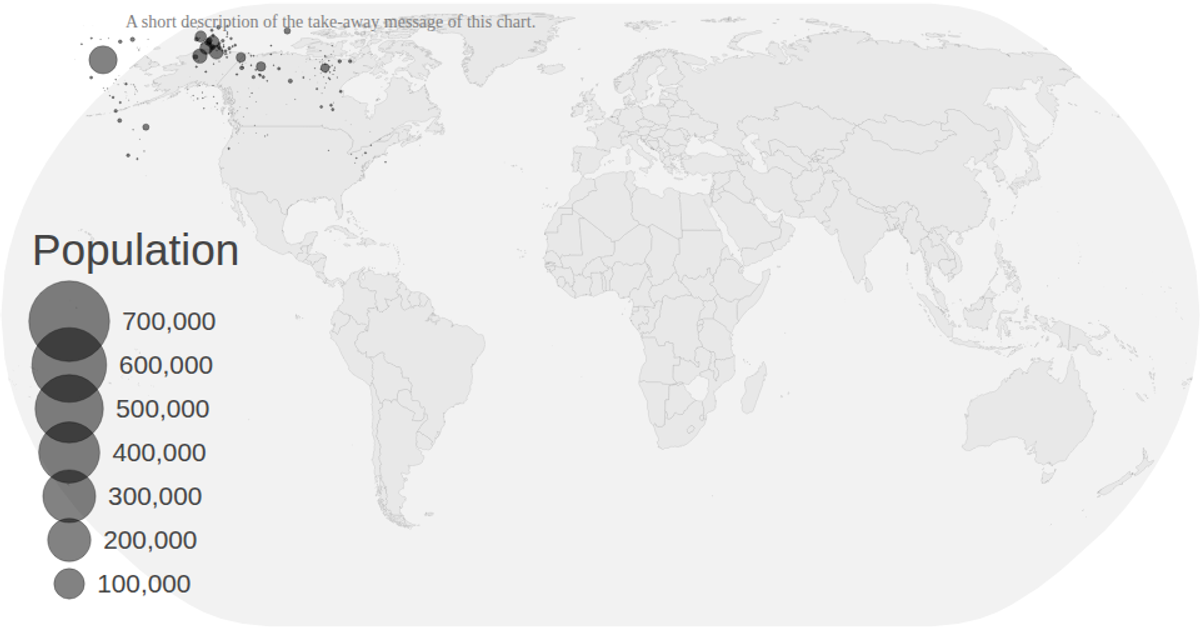
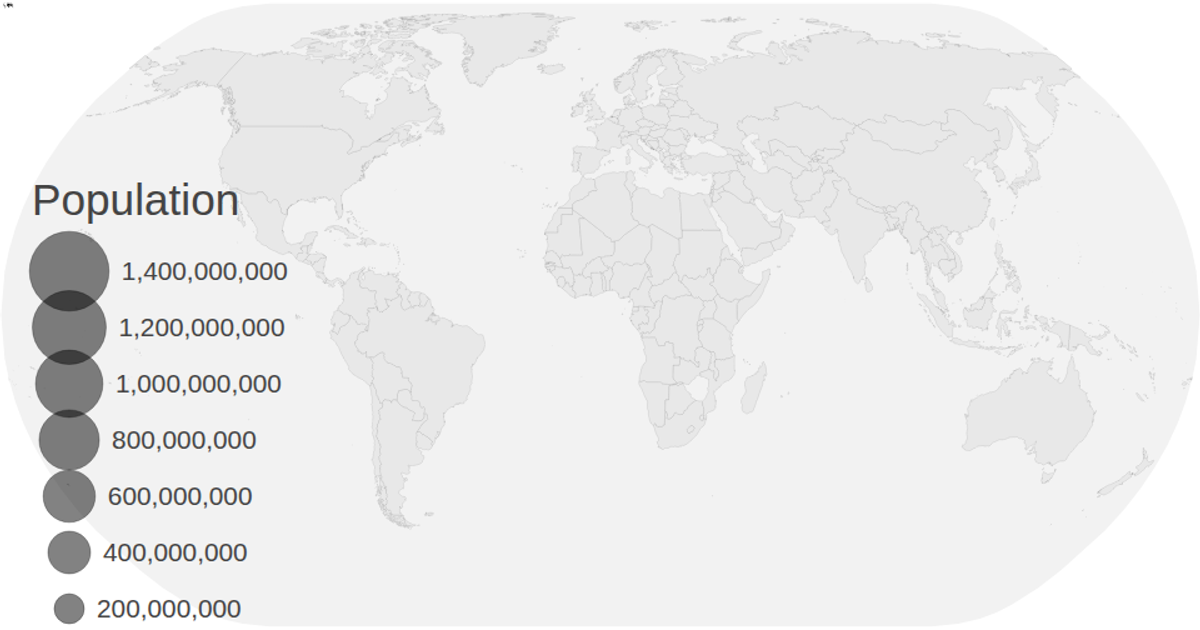
This visualization displays population projections for countries on a natural Earth map, with animated circles representing data values that transition across years (2030–2040) from a CSV dataset. It uses D3 v5 with `geoNaturalEarth1` and `geoPath` to render country boundaries, while `scaleSqrt` sizes the circles based on population values. The map supports zooming via `d3.zoom`, and a color legend and size legend accompany the chart. Data is loaded from CSV and TopoJSON files, with circles animating their radius and position over time.
AI-generated descriptionMIT Licensed



Comments
Sign in to join the discussion.