
0 views in last 90 days
sophburke
@sophburke
Public vizzes

Line Chart - from Working with Time
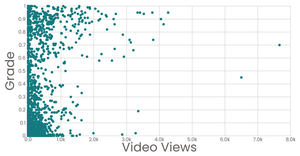
Sophie's Stylized Scatter Plot v.2

Final Project - Video Analytics, EdX, 2013
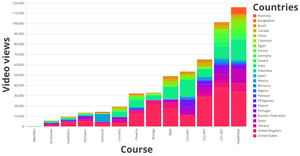
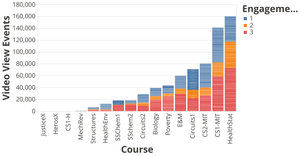
EdX Viewer Data by Course with Stacked Bars, AY2013

EdX Viewer Data by Course, AY2013, AY2013

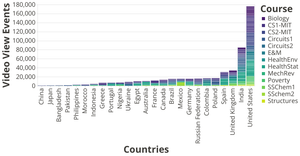
EdX Viewer Data by Course and Country, AY2013

EdX Viewer Data by Course and Country, AY2013

Dropdown attempts - EdX Viewing Patterns by Country, 2013
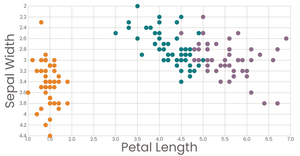
Scatter Plot with Color

Jim's Help - EdX Viewing Patterns by Country, 2013

Scatter Plot with Menus
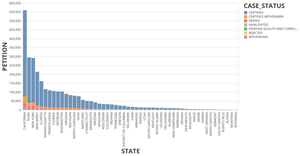
H1b Petition in Different States
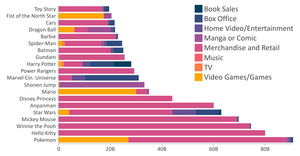
Stacked Franchise Revenues by Revenue Category
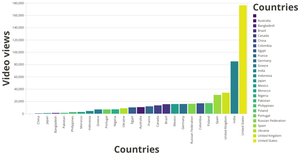
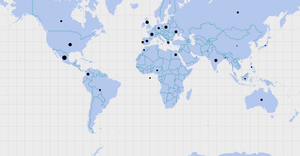
EdX Video Views by Country, AY2013
EdX Video Views by Course, AY2013

Messin - EdX Video Views by Country, AY2013

Sophie's Polished Scatter Plot with Menus

Aggregated, Interactive Common Cocktail Ingredient Pairings

Interactive Color Legend with EdX Viewer Data

Interactive Color Legend with EdX Viewer Data

EdX Viewing Patterns by Country, 2013
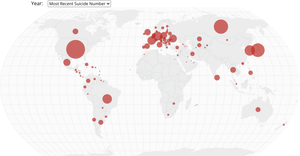
Worldwide Suicide Map with Menu

Curran's version: Aggregation by Country using Excel + Dropdowns!
React Starter
Aggregation by Country + Dropdown
Aggregation by Country + Dropdown

React Starter
Ok, what about a color legend

Sophie's version: Aggregation by Country using Excel

The version I will mess up

Worldwide Suicide Map with Menu
From Chen Ding: Aggregation by Country using Excel + Dropdowns!
Menus with React -Aggregation by Country + Dropdowns!

Worldwide Suicide Map with Menu

Worldwide Suicide Map with Menu
Tweaking WenLei Cao's MA Safety Map
Sophie's version: Aggregation by Country using Excel + Dropdowns!

Massachusetts safe town/city selector by county and community

Scatter Plot with Menus

Sophie's version: Aggregation by Country using Map
Aggregation by Country using Map

EdX Viewership 2013: Aggregating in App! back to normal, 10:23

EdX Viewership 2013: Aggregating in App!
EdX Viewership 2013: Adding Dropdowns

Sized Points on a Map using videoData!
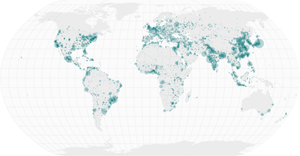
Sized Points on a Map
Missing Migrants Scatter Plot

Missing Migrants Date Histogram

Massachusetts safe town/city selector by county and community

EdX Viewership Map, 2013
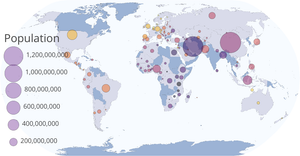
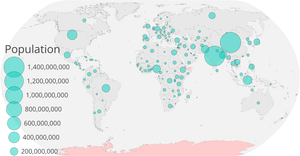
World Happiness Scores by Population
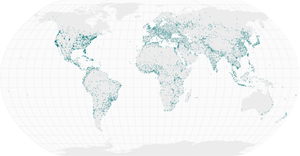
Points on a Map
Circles on a Map

Sophie's Let's make a map with D3.js!

Interactive Color Legend

Sized Points on a Map

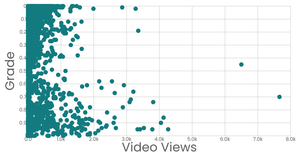
Scatter Plot with Color Legend

Sophie's Polished Scatter Plot with Menus

Polished Scatter Plot with Menus

Polished Scatter Plot with Menus and Color

Menus with React

React starter
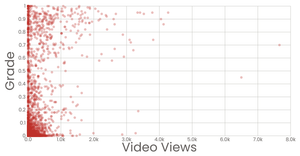
Sophie's Stylized Scatter Plot v.3

Curran's Stylized Scatter Plot
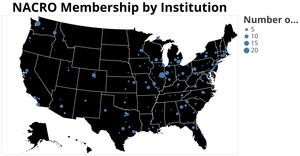
NACRO Membership by Institution
Sophie's Stylized Scatter Plot v.1

Video Views by Country

Harvard X-MITx Viewership by Country

Making a Bar Chart with React & D3 - no Axes

Viewing Data with React & D3
Trying to Use D3 with Viewing Data
A D3 chart

Harvard/MitX Video Views
Harvard/MitX Video Views

World Map First Pass
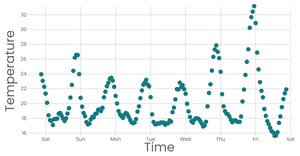
Working with Time

The Margin Convention

Harvard/MitX Engagement

Harvard/MitX Video Views

Loading Data with React & D3

Rendering Data with React & D3 part 1

Rendering Data with React & D3
Customizing Axes

Participants in Opiate Treatment Study

The Low- to Moderate-Income (LMI) New York State (NYS) Census Population Analysis dataset

HarvardX, MITX 2013-2014 Users

Smiley face pt1
