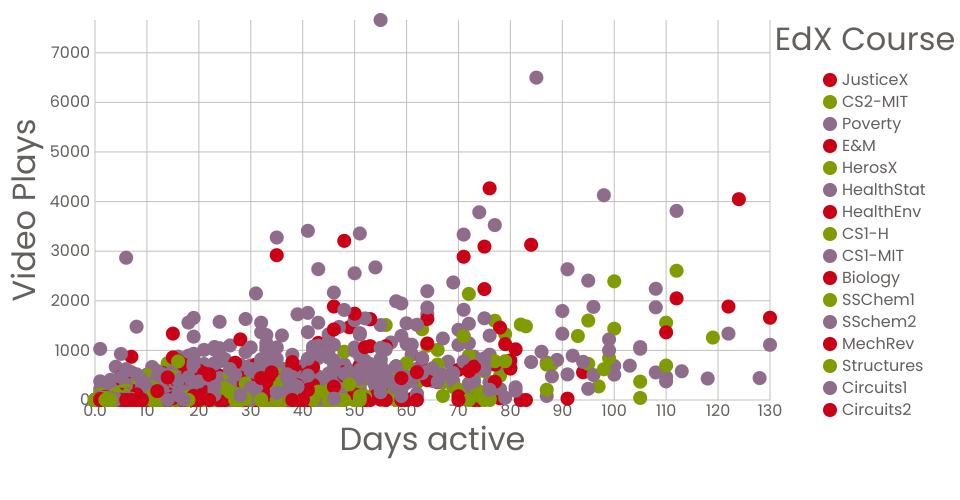
A visualization of showing the number of plays per person according to the number of days they were active on the EdX platform during the 2013 academic year. The color legend shows which courses garnered the most views. The data can be found on the MITx-HarvardX Dataverse.
MIT Licensed