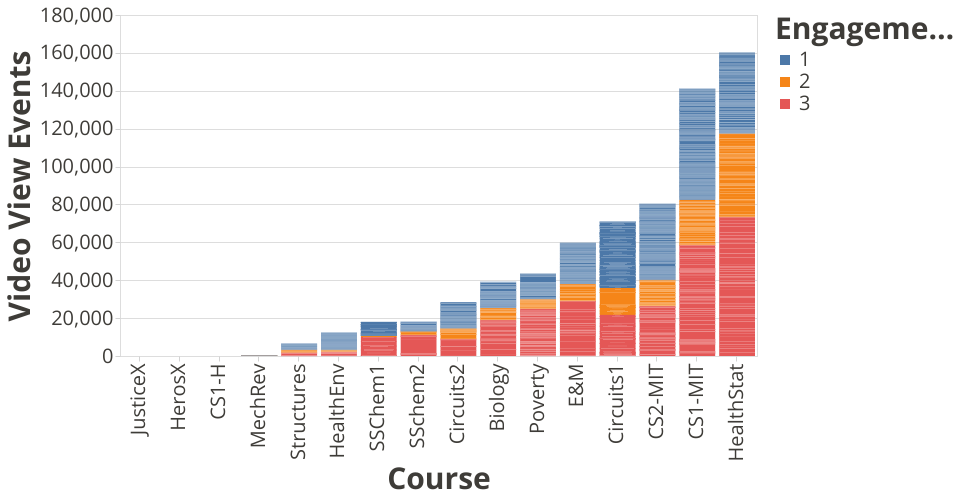
A visualization of video views according to HarvardX or MITX course on EdX for the 2013 academic year. The bars show stacks according to level of engagement, which ranges from:
1 (students accessed the courseware)
2 (students accessed at least half the courseware materials)
3 (students achieved a certificate)
The visualization was constructed using the vega-lite-api and the data can be found on the MITx-HarvardX Dataverse
MIT Licensed