🌍 Public
Fork of Cheap Tricks for Interaction
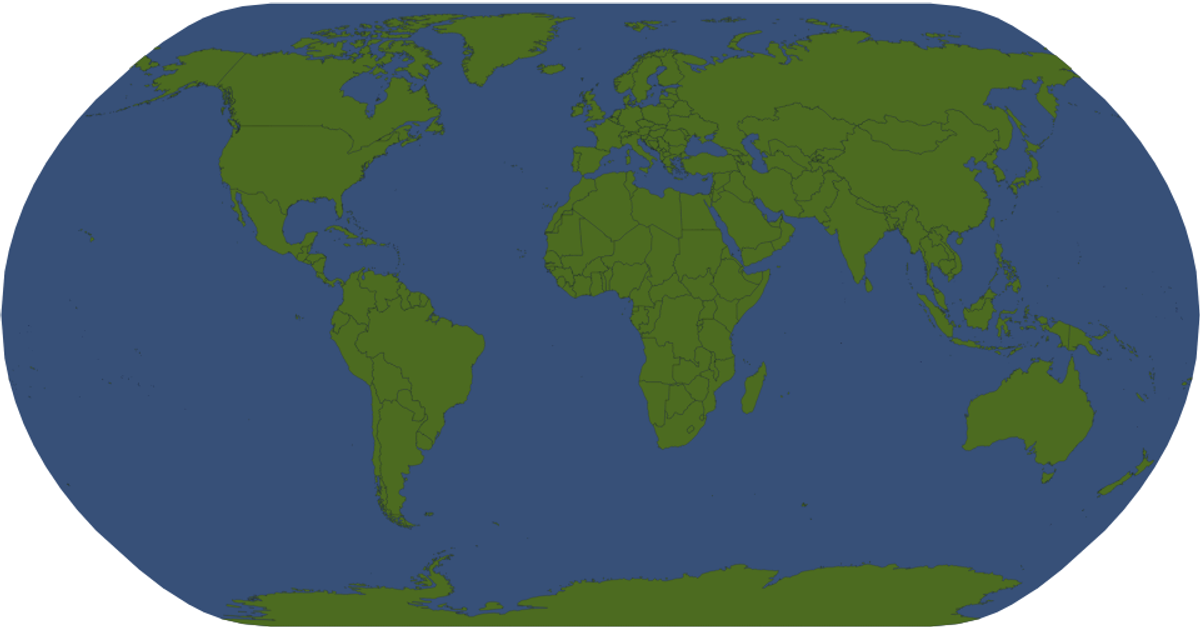
This example renders a world map using SVG paths generated with `d3.geoPath` and a Mercator projection, populated with country outlines from the world-atlas dataset. The resulting map displays country names as tooltips when hovering, and countries turn red on mouse-over. The visualization loads geographic data from a TSV file for names and a TopoJSON file for shapes, processed with the `topojson` library. Pan and zoom interactions are enabled through the `d3.zoom` API, allowing users to explore the map in detail.
AI-generated descriptionMIT Licensed


Comments
Sign in to join the discussion.