🌍 Public
Fork of Cheap Tricks for Interaction
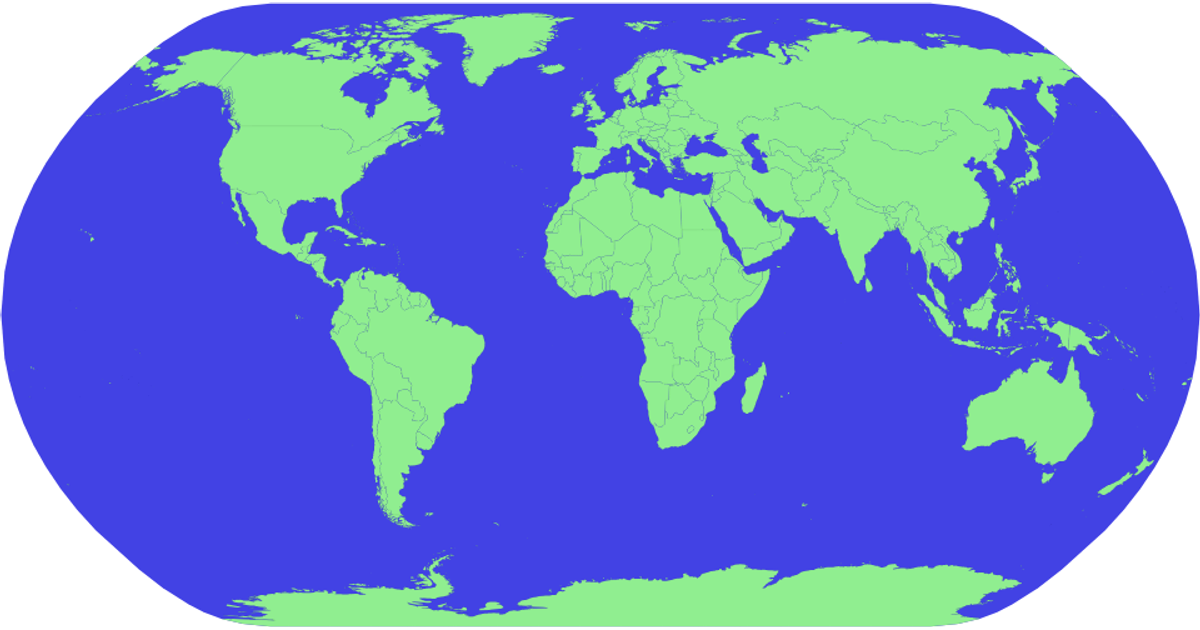
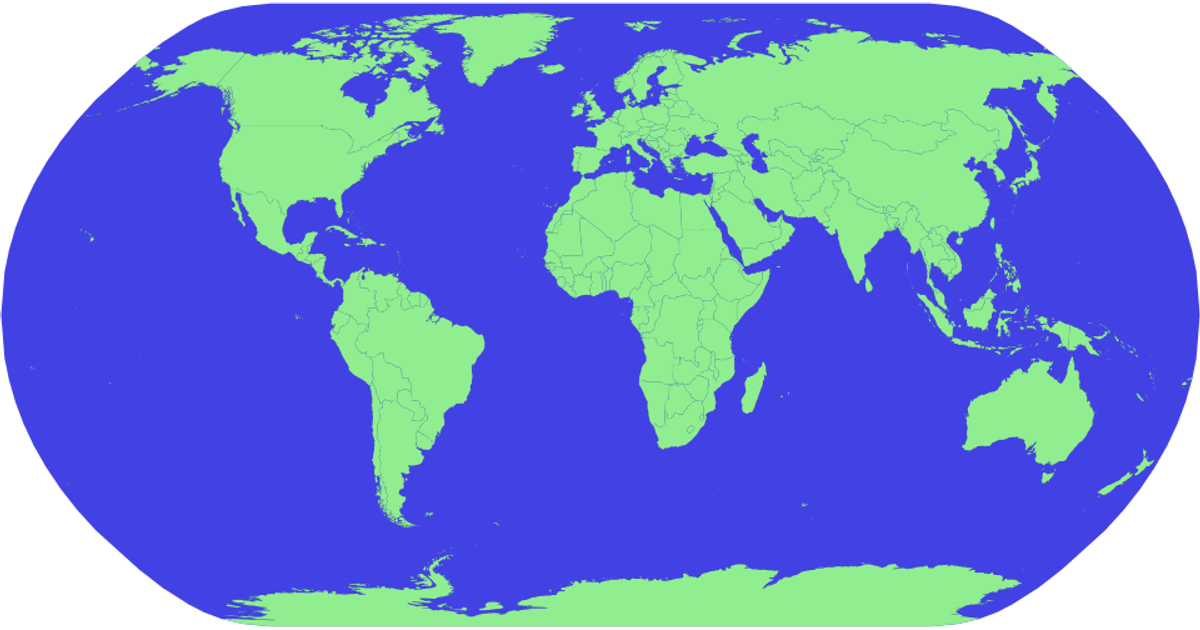
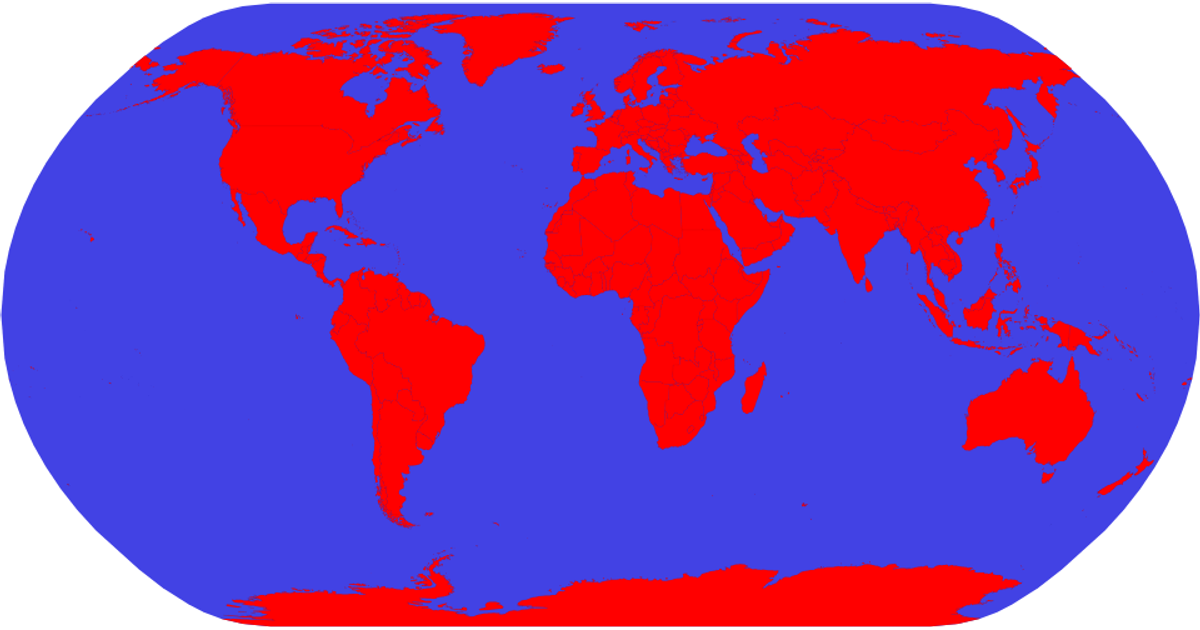
This example shows an interactive world map rendered with SVG paths. It presents countries in light green against a blue spherical background, and hovering over a country turns it red. The visualization uses a D3 geoNaturalEarth1 projection with a geoPath generator to draw continents from a world-atlas TopoJSON dataset. The code imports from d3.js v5 and TopoJSON, and it handles zooming and panning through D3’s zoom interaction, which applies a transform to the map group on zoom events.
AI-generated descriptionMIT Licensed


Comments
Sign in to join the discussion.