Skip to main content
Explore
Solutions
Services
Pricing
Quick Start
Demo
Start free
Log in
Send feedback
✕
Tell us what works and what could be better. We read every submission.
Send feedback
✕
Tell us what works and what could be better. We read every submission.
R
Rohith arabati
@rohith2803
·
28 public vizzes
Social Network graph
Apr 4, 2022
ICE-8: Family Tree
Apr 4, 2022
Centered US Map
Apr 3, 2022
ICE-8 World Map
Apr 3, 2022
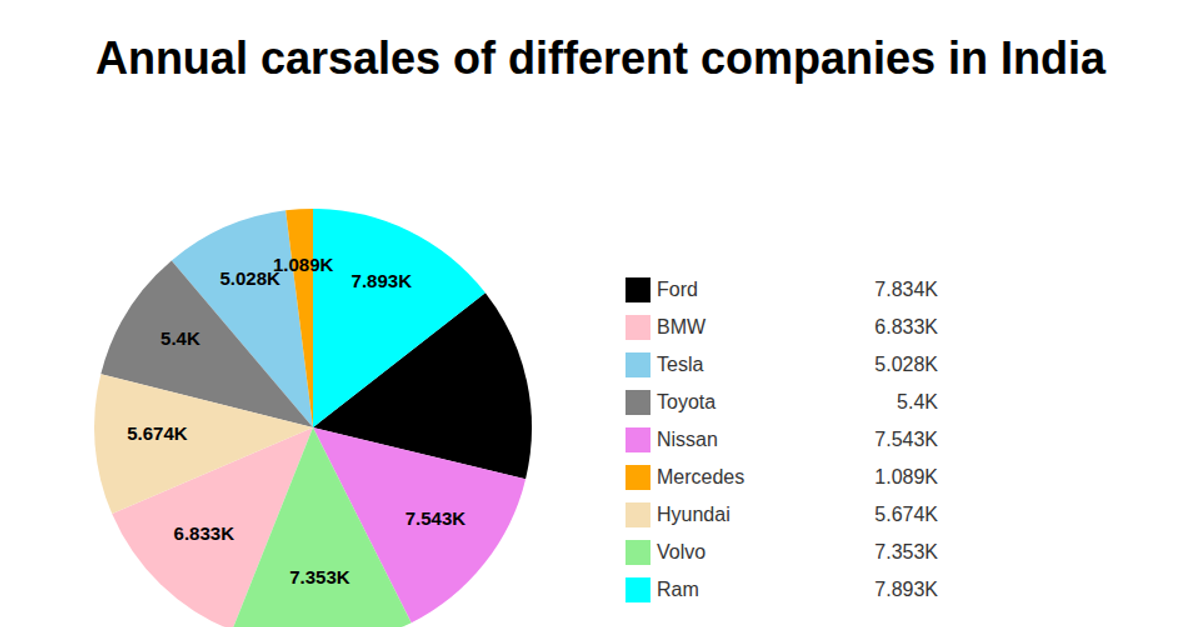
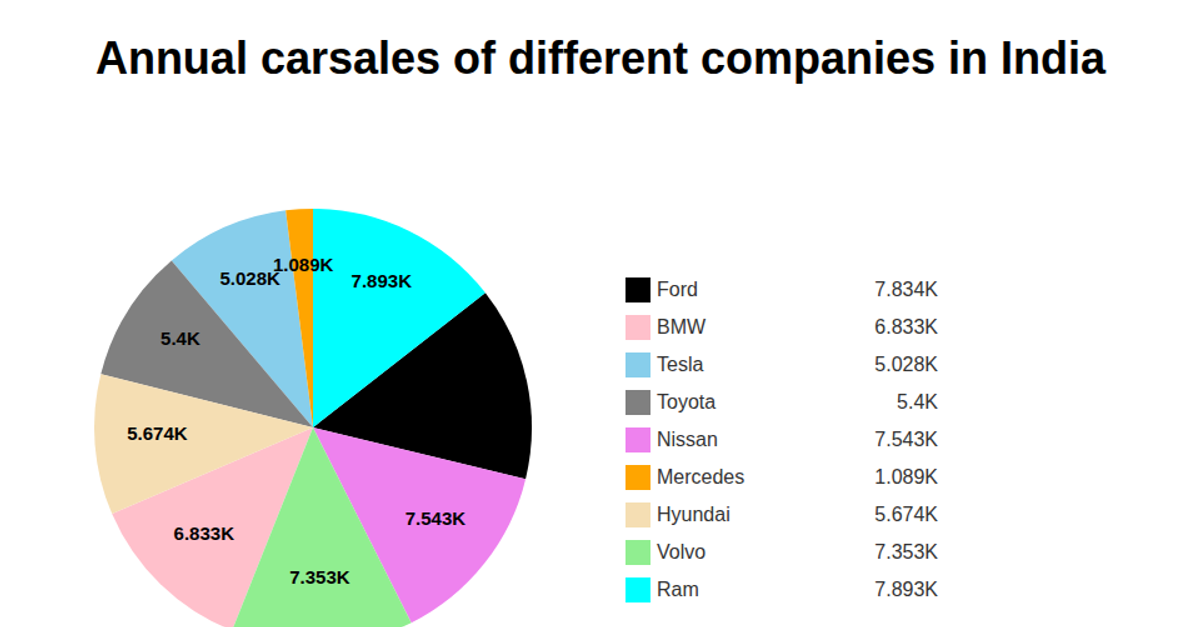
Fork of ICE - 7 Pie Chart Maanas Katta
Mar 27, 2022
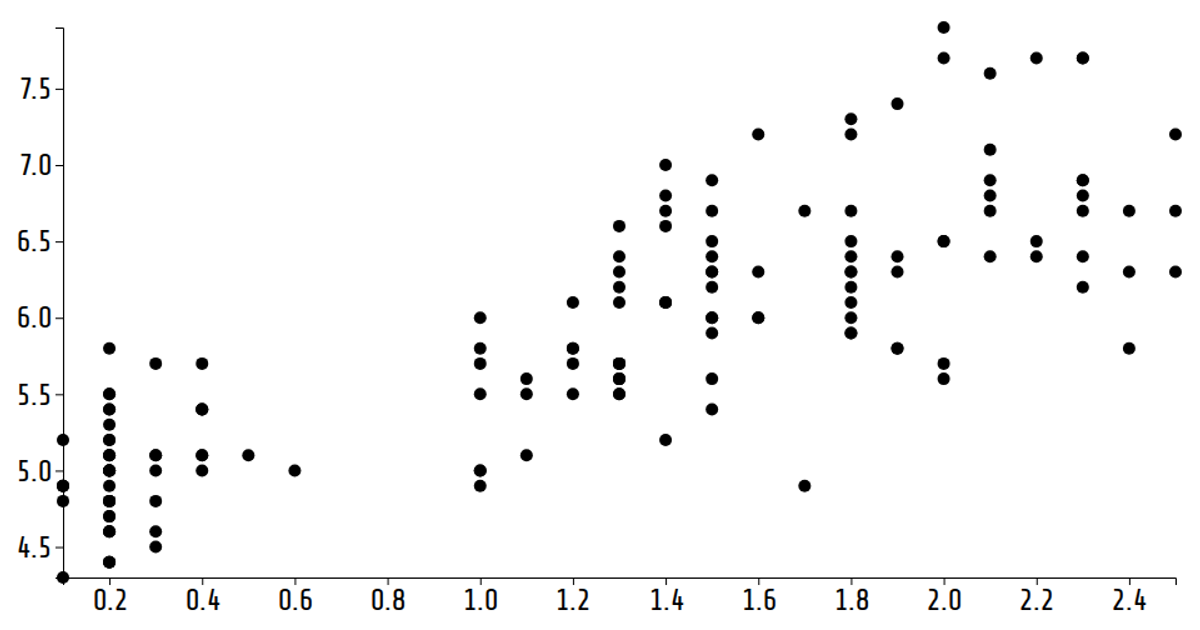
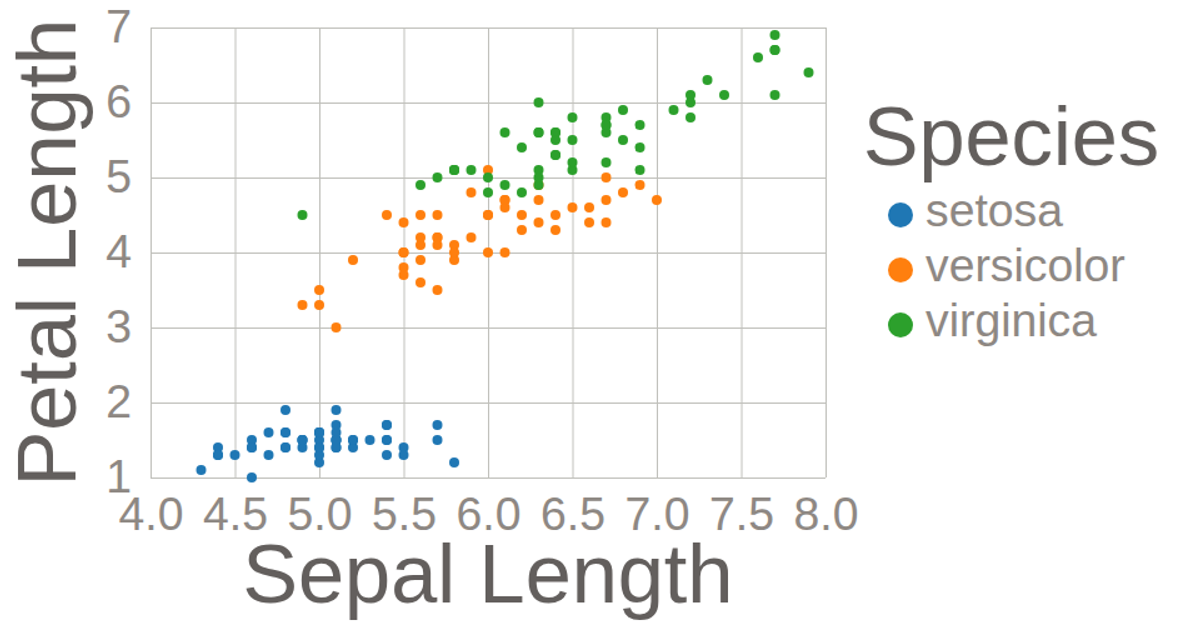
Fork of Fork of Data Visualization- Scatter Plot with Iris DataSet
Mar 27, 2022
Area chart-ICE-07
Mar 27, 2022
Fork of line chart section 3
Mar 27, 2022
Fork of ICE-6: Rendering Marks and Channels with React & D3
Mar 27, 2022
Piechart ICE - 7 Rohith Arabati
Mar 26, 2022
Fork of Fork of ICE - 7 Pie Chart
Mar 26, 2022
Fork of Stylized Line Chart
Mar 26, 2022
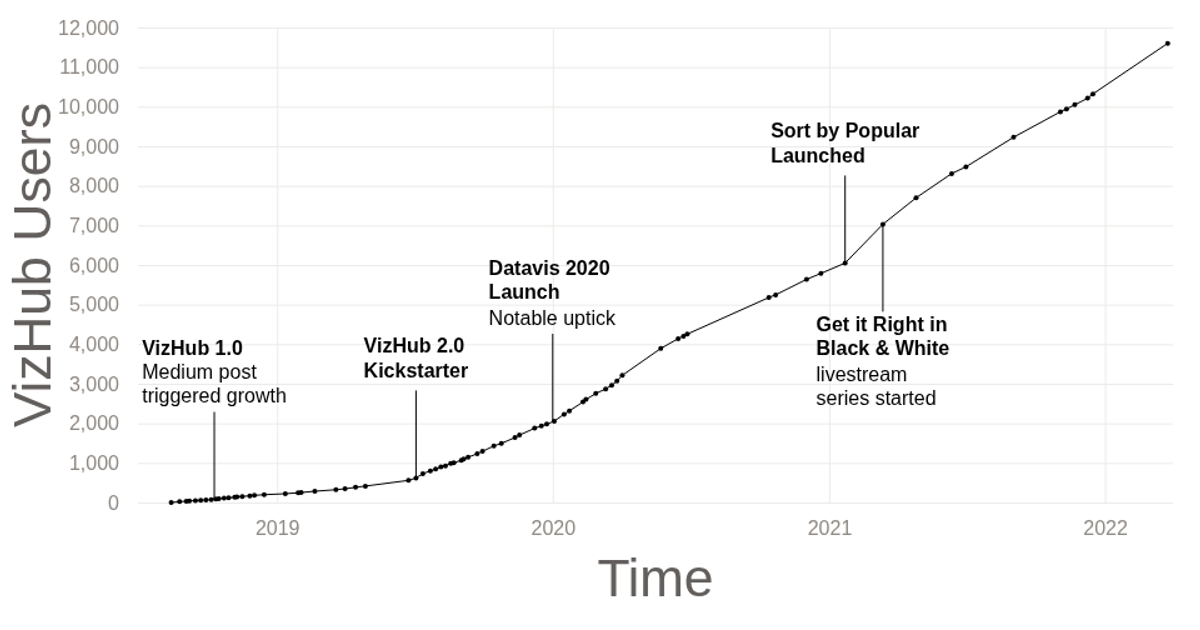
Fork of VizHub User Count Over Time
Mar 26, 2022
Fork of ICE - 7 Pie Chart Maanas Katta
Mar 26, 2022
Fork of Reusable D3 Scatter Plot
Mar 26, 2022
Fork of ICE - 7 Pie Chart Maanas Katta
Mar 26, 2022
Fork of Reusable D3 Scatter Plot
Mar 26, 2022
Fork of Reusable D3 Scatter Plot
Mar 24, 2022
Scatter Plot with Iris DataSet
Mar 7, 2022
IRIS Dataset Scatter plot
Mar 7, 2022
IRIS Dataset Scatter plot
Mar 7, 2022
Fork of Fork of ICE-6: Rendering Marks and Channels with React & D3
Mar 7, 2022
Fork of Fork of Stylized Scatter Plot with Color Legend
Mar 7, 2022
csvdata
Feb 27, 2022
Fork of ICE-5: Loading and Parsing CSV Data with D3.js
Feb 27, 2022
Fork of emoji-like face with mouth (D3)
Feb 20, 2022
Fork of Hello HTML
Feb 19, 2022
Fork of Smiley Face Part IV
Feb 19, 2022