🌍 Public
Fork of VizHub User Count Over Time
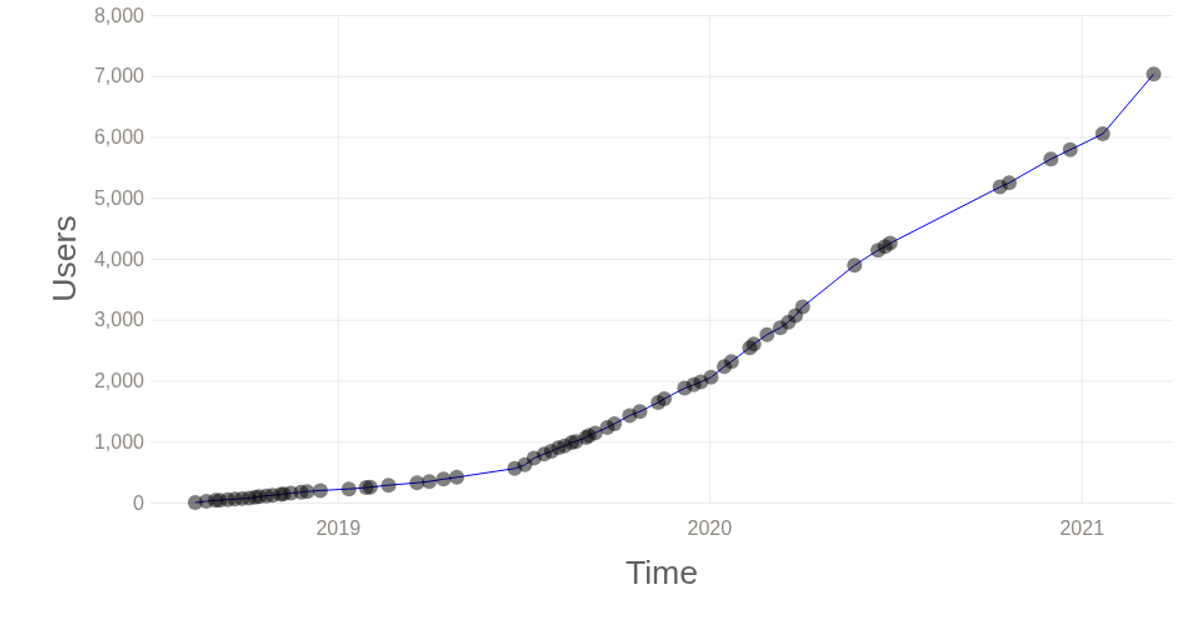
This fork of a VizHub dashboard shows the cumulative growth of unique users over time, from the platform’s launch in August 2018 through March 2022. A single black line traces the upward trend, with small circles marking each data point. D3 v4’s `d3.line`, `d3.scaleTime`, `d3.scaleLinear`, and axis components render the SVG chart, while the `d3-svg-annotation` library adds labeled callouts for notable events like the VizHub 2.0 Kickstarter and the Datavis 2020 launch. Data comes from local CSV file `users.csv`.
AI-generated descriptionThe number of total unique logged in VizHub users over time, since it was launched on August 14, 2018.
See also index of courses.
MIT Licensed




Comments
Sign in to join the discussion.