🌍 Public
Fork of Stylized Line Chart
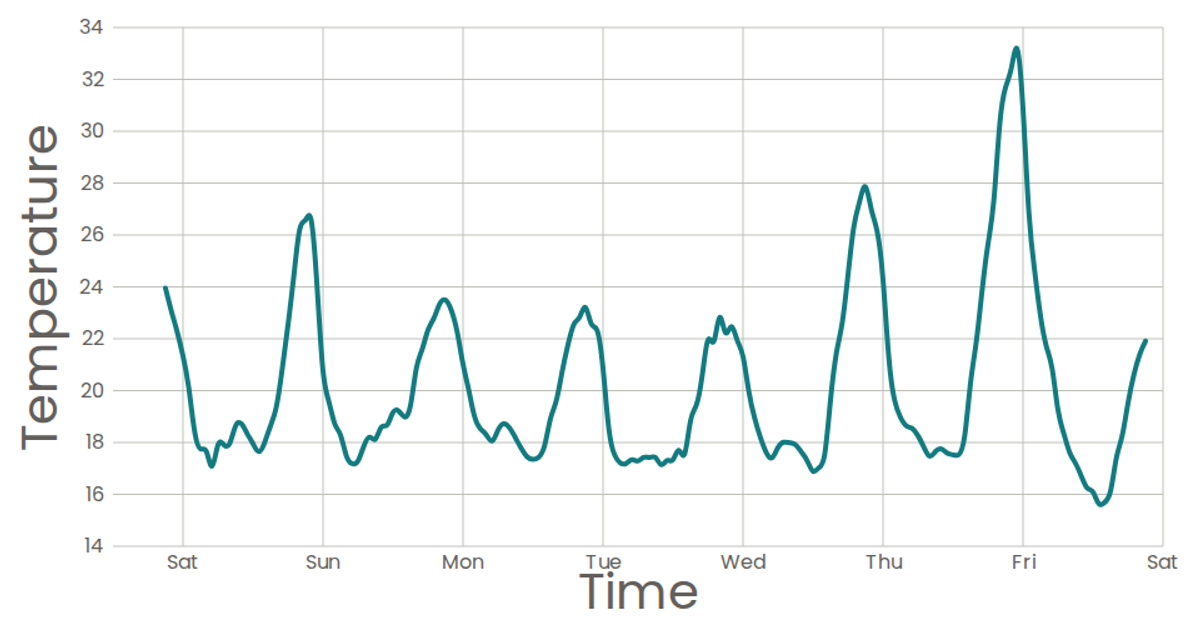
This line chart shows temperature readings over the course of a week using a smooth, natural curve. The React app loads CSV data from a GitHub-hosted dataset about San Francisco temperatures, then renders the visualization as SVG. It uses d3.scaleTime for the x-axis, d3.scaleLinear for the y-axis, and d3.line with curveNatural to draw the path, with styled tick marks and axis labels in the Poppins font.
AI-generated descriptionA scatter plot of Data Canvas Sense Your City Dataset.
MIT Licensed




Comments
Sign in to join the discussion.