
I am a UX architect who has designed data viz tools such as Ellie Mae Insights. Designed and half built Project Coverage with a friend on Observable and was looking for a course to shore up my overall understanding of D3 so I could do something like AVITML. Found Data Visualization with D3, JavaScript, React - Full Course [2021] on Youtube and am working my way through it.
Very nice! Welcome. Happy that you have landed here.
Hello everyone!
I’m Drew, and I am currently nearing completion of an undergraduate degree in Informatics. Before returning to school to earn my degree I was a bartender and waiter here where I live in Indianapolis, Indiana in the US. During my studies I’ve developed a fondness of data visualization and I just recently stumbled across Viz Hub during some research on D3 and Vega. I’m really encouraged by the level of curriculum here and the accessibility of this quality learning. I can only imagine the amount of work going into something like this and I just want to say, Thank You!
Cant wait to continue learning!
Welcome @HoosierEx317! Thank you for the compliments  .
.
It has been a ton of work indeed, but I love this stuff. Happy to hear it is appreciated.
Hi
I am Alim…:-)… currently in Bali and training myself to be a web developer (seemed easy at first but realising that it’s not as easy as it seems!)…:-)…
I chanced upon your youTube video… and it looked nice and interesting… I really like and appreciate your ‘intentionally slow paced’ method of training.
I’ve reached just the 4th hour of your training and had one question…
My current requirements are bar graphs for a project… and although SVGs seem like a good choice… but with flexbox and grid, would it be a ‘smarter’ choice for me to use those?
Although I would continue to learn more about SVG as I am really interested in this format and it’s getting more exciting now that I am learning to write svg code, but for just bar graphs presentation, I am beginning to think that flexbox or grid with animation using CSS and JS would be easier… am I right?
If you do get time to check my comment on this thread, please do share your opinion on this. It would help me plan a bit on my current test project.
Regards,
Alim
Greetings! Indeed, you can totally make a bar chart with divs and Flexbox. You can even use D3, still, to compute the heights of the rectangles and set that with inline CSS (using the .style() selection method). Using D3 does not necessarily mean using SVG, and that’s a beautiful thing.
So I would say go for it! It will definitely be a good learning experience, and will most likely lead to a working and readable bar chart. Good luck!
2 Likes
Hi !!
I’m Kerim , A syrian refugee in Turkey , i’m 31y old , i was a chef for most of my life untill i decided that i need a career change , i heard about this course in FCC , i’m currenty following the “get it right in black and white” course on youtube . so far so good , though the svg mask thing was a bit counfusing at the start  .
.
2 Likes
Hello and welcome! Yeah the SVG mask maybe was a bit too complex a concept to introduce so early in that course. Thanks for the feedback!
1 Like
Thank you so much for all yor time and effort , the course is amazing and full of useful informations , i really appreciate all the hard work you’re doing to give all of a us a chance to learn .
1 Like
I am glad I found this course, I find it well done and excellently explained. I still have some JS concepts to learn, and then I get all into 3d!!! Thank you!
1 Like
Hello! I am Toly from California. I work in cybersecurity and am getting my MS in Data Science from GeorgiaTech.
I have a D3-heavy class and zero experience in D3 and JS. Thus, my goal is to get D3/JS-101 before the class
1 Like
Awesome! Welcome.
I’m curious, which class is it that uses D3? Is it part of a data science program or something?
I hope the various resources here will be useful to you!
See also Index of Courses
1 Like
Merry Christmas, Curran! Thank you for dropping a note!
CSE6242 is one of the advanced core classes for an MS Data Science program at Georgia Tech. Here is the li k to the syllabus: https://poloclub.github.io/cse6242-2022spring-online/
It is called Data Visualization and uses D3 heavily. In addition, it throws at students a bag of other technologies such as Pig, Hive, SQLite, JS, Spark, and Hbase.
My problem is that, except for Python and R, I have zero experience in JS, D3, etc. So I am trying to get some basics at least.
There are four homeworks and a team project in this class. No exams. But the HWs are very extensive. So I am very concerned.
My focus is D3 (based on the review of the former students). However, I also need to get some HTML and JS basics.
I started going through your 2022 course. It will be beneficial!
One question about the Viz environment: when I fork an existing index file and rename it, where can I find the file with the old name? There is no SAVE option, so I need clarification.
I intend to use these templates in my HWs.
Thank you!
Toly
Curran, can you share the final code for Sol Lewitt? I followed but do not have the image. I want to compare your code with mine.
Thank you
Oh nice! Looks like his course playlist is on YouTube, which is sweet. Lots of stuff there in addition to visualization wow.
I think this is the final code for Sol LeWitt:
First let me make sure I understand what you’re saying:
- When you say “fork an existing index file”, I think that means that you fork the viz by clicking on the Fork icon and clicking through the dialog.
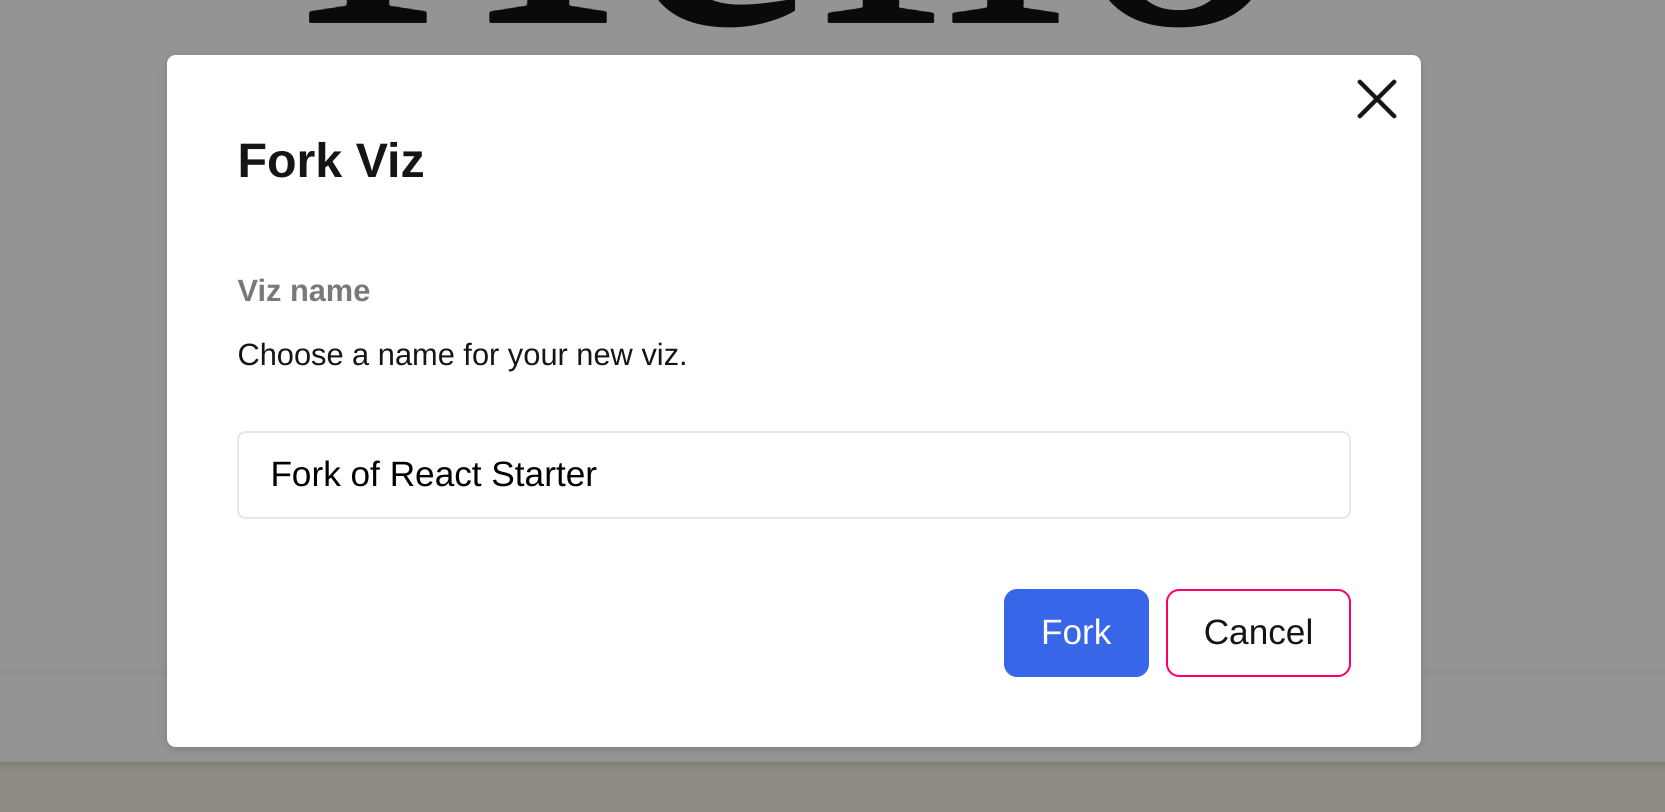
- After you have forked a viz, that viz shows you which one it was forked from right below the running program on the right side, like this:
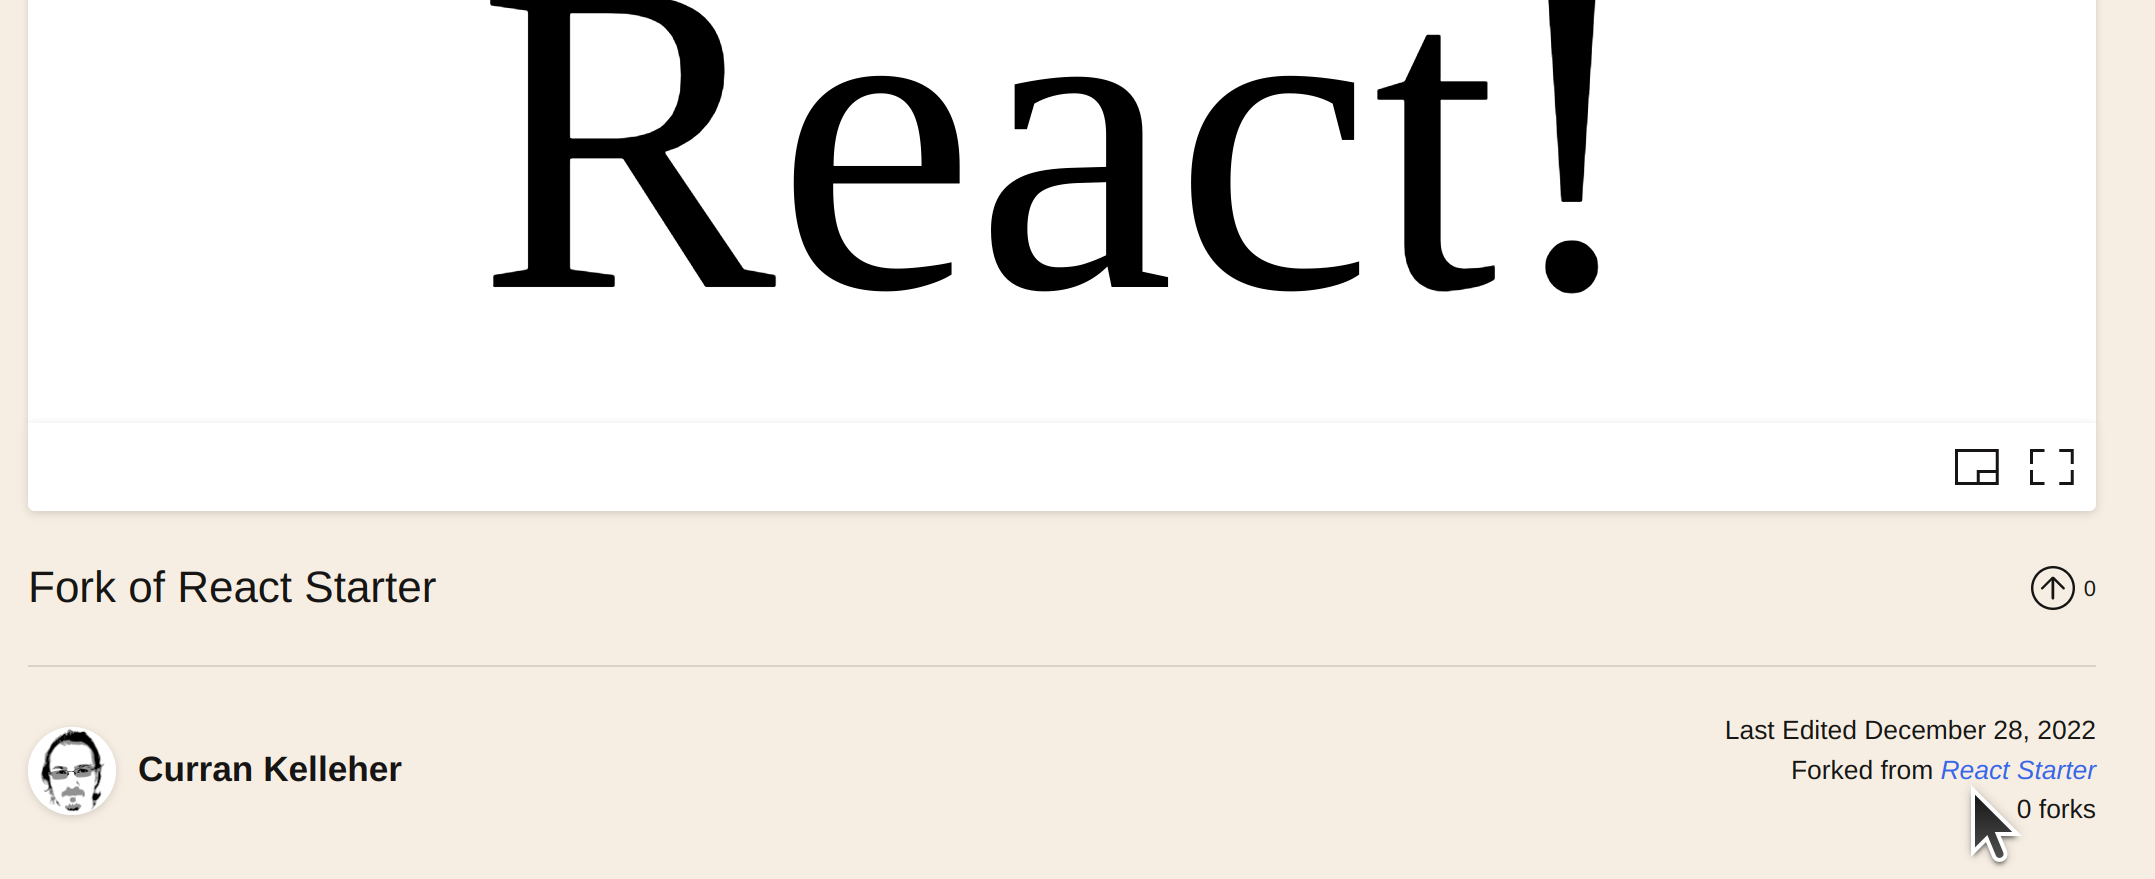
Does that answer your question?
yes it does! Thanks!
One more question. can you recommend a good episode where you explain ingestion of the data from the website into D3?
Curran, as an absolute novice to JS and D3, I am struggling even with some simple subjects(((
The colors.
I saw your file for reusable scatter plots with different symbols per specie (iris dataset). I want also to incorporate the colors.
-
.colorValue((d) => d.species) - index.js (within svg.call block) - in the scatterplot.js: here I have difficulties
I understand I need incorporate “color” somehow
export const scatterPlot = () => {
let width;
let height;
let data;
let xValue;
let yValue;
let symbolValue;
let margin;
let color;
let size;
Then
const colorScale = scaleOrdinal()
  .domain(data.map(color))
  .range(???????);
I am doing something wrong, I am sure
please, direct me
This might be a good one for that Loading and Parsing CSV Data.
This might be a good one for that: Scatter Plot with Color
These links have lecture videos embedded. Enjoy!