
Please introduce yourself here!
I’m Waseem, a pharmacist and master’s degree student in biostatistics.
I started a data science learning journey around 3 years ago, and after trying a number of domains and a ton of technologies, I found myself gravitated towards data visualization in general and the web-based side in particular.
My visualizations, so far, mostly fall under the “statistical graphics” category, and some of them are more closely related to the medical field. But I’m branching out of that category to explore the large D3 world!
5 Likes
Thanks @waseem-medhat for getting this thread started!
If I may - I’d like to highlight some of my favorite pieces you’ve created, which are amazing to see.
4 Likes
Wow! I’m so glad you liked them. Thanks a lot!
1 Like
Hello everyone! I’m Adil, and I’m very glad to be here. I’m based in the UK, and I work in the Informatics department of a NHS Trust. My work is pretty SQL-heavy, but I became enamoured with D3.js a while back, and am now investing the time needed to learn it deeply. It’s become clear for me that, within the vast JavaScript ecosystem, data visualisations and simulations, with technologies such as D3.js and React, are what personally spark joy for me.
I’ve recently had a baby daughter, and she’ll be evaluating print-outs of my work as I continue to go through this course. It’s a playful, fun journey that also introduces React and all the advantages that brings. I wish more learning experiences were less scary and forbidding like this - thank you very much, Curran! I’m excited about the future of VizHub, and the happy ease with which it already allows me to get thinking and coding straightaway.
5 Likes
Hello everyone  I am Nita. I am too, a data visualization enthusiast. My journey of data visualization started with guidance from Curran. ( I am actually his wife and I hear data visualization almost every day.) I am Looking forward to continuing working with D3 and in the future with React. VizHub made the learning process a lot easier. It’s amazing when you run your code and the result is a magic visualization. Hoping this Community here will keep the spirit of everybody. Thanks to Curran for developing VizHub. Looking forward to learning more and help others.
5 Likes
Oh hey I forgot to introduce myself myself!
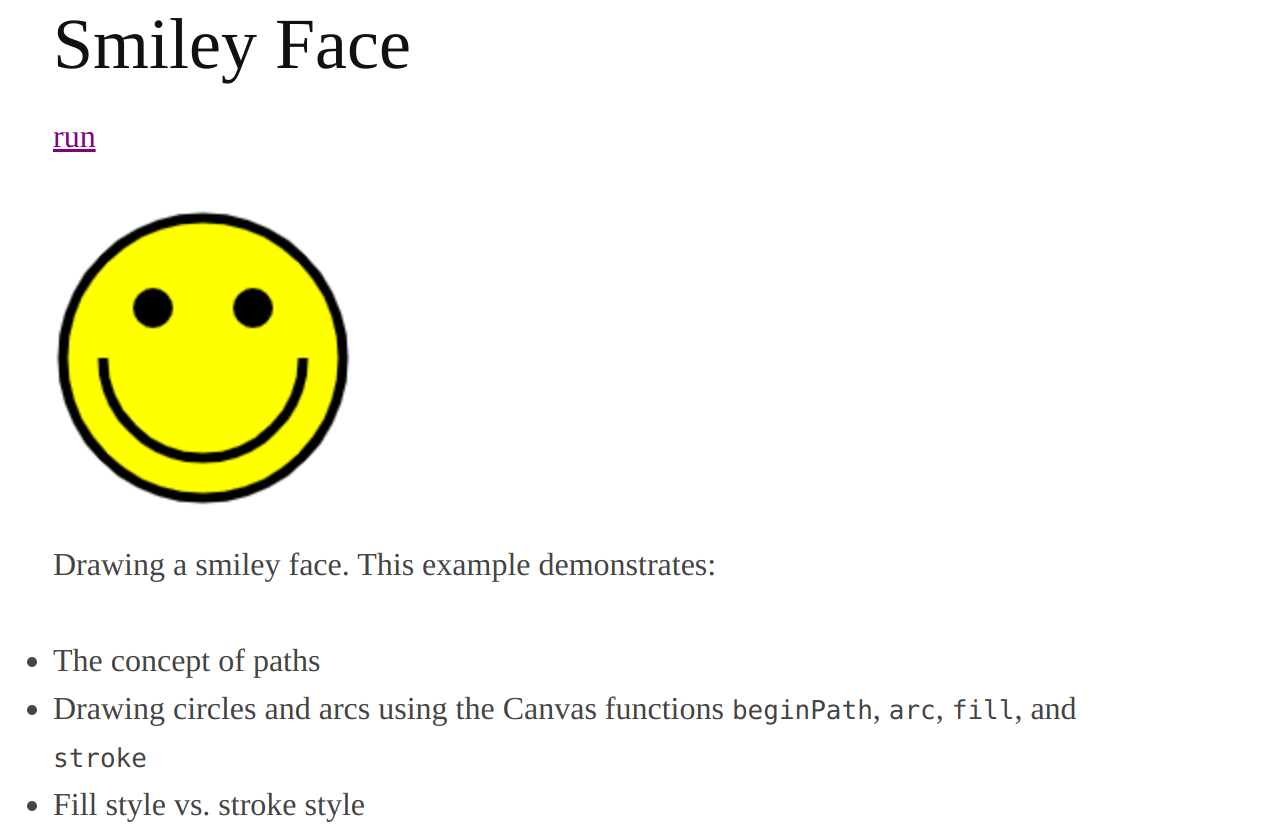
Hello , I’m Curran. I started in data visualization coding work way back in 2005, where Java was the tech of choice, in a research lab at UMass Lowell led by Georges Grinstein. During my 9 years at UMass Lowell I was very active in learning and using tech of the day, which at some point transitioned to Adobe Flash (ActionScript), and finally HTML5 and JavaScript with Canvas. I ended up volunteering to teach high school students at MIT about graphics coding over two summers, and this is the end result of that: HTML5 Examples (code). That was actually the first time I used the smiley face example for teaching.
It was only after doing this sort of work for several years that I stumbled across D3. I recall vividly watching Mike Bostock’s presentation of the 2011 D3 Paper at the IEEE Vis conference that year. It made huge waves and everyone in the visualization community was so excited that there was this new Open Source tool available that will let you create Web-based interactive visualizations.
In 2015 I lived in San Francisco for a year. I was working at a “Big Data” startup called Alpine Data Labs. That’s when I really came into contact with the “D3 Community”, via regular Meetup events in the Bay Area. At that time, bl.ocks.org was extremely popular, and I started using it quite a bit as a platform for generating new examples and sharing work.
After that I started my owm company, Datavis Tech INC, with the goal of providing client services and also building a platform similar to bl.ocks.org but with additional features such as a built-in editor and real-time collaboration. At that point I moved to India (with my wife @Nita) and transitioned to 100% remote work. We lived in India for 4.5 years before returning to the US in January 2020.
While in India I took a gig as an adjunct teaching professor with Worcester Polytechnic Institute. The gig was to teach a 100% online course for 10 weeks each Fall. After doing that the first time, I started working on VizHub as a side project to help with running the course. The idea was that I could use it to produce lecture videos and the students could use the same exact tool to do their homework assignments and projects. VizHub started out very buggy, and through feedback from students it was evolved and iterated to become a usable tool, “VizHub 1.0”.
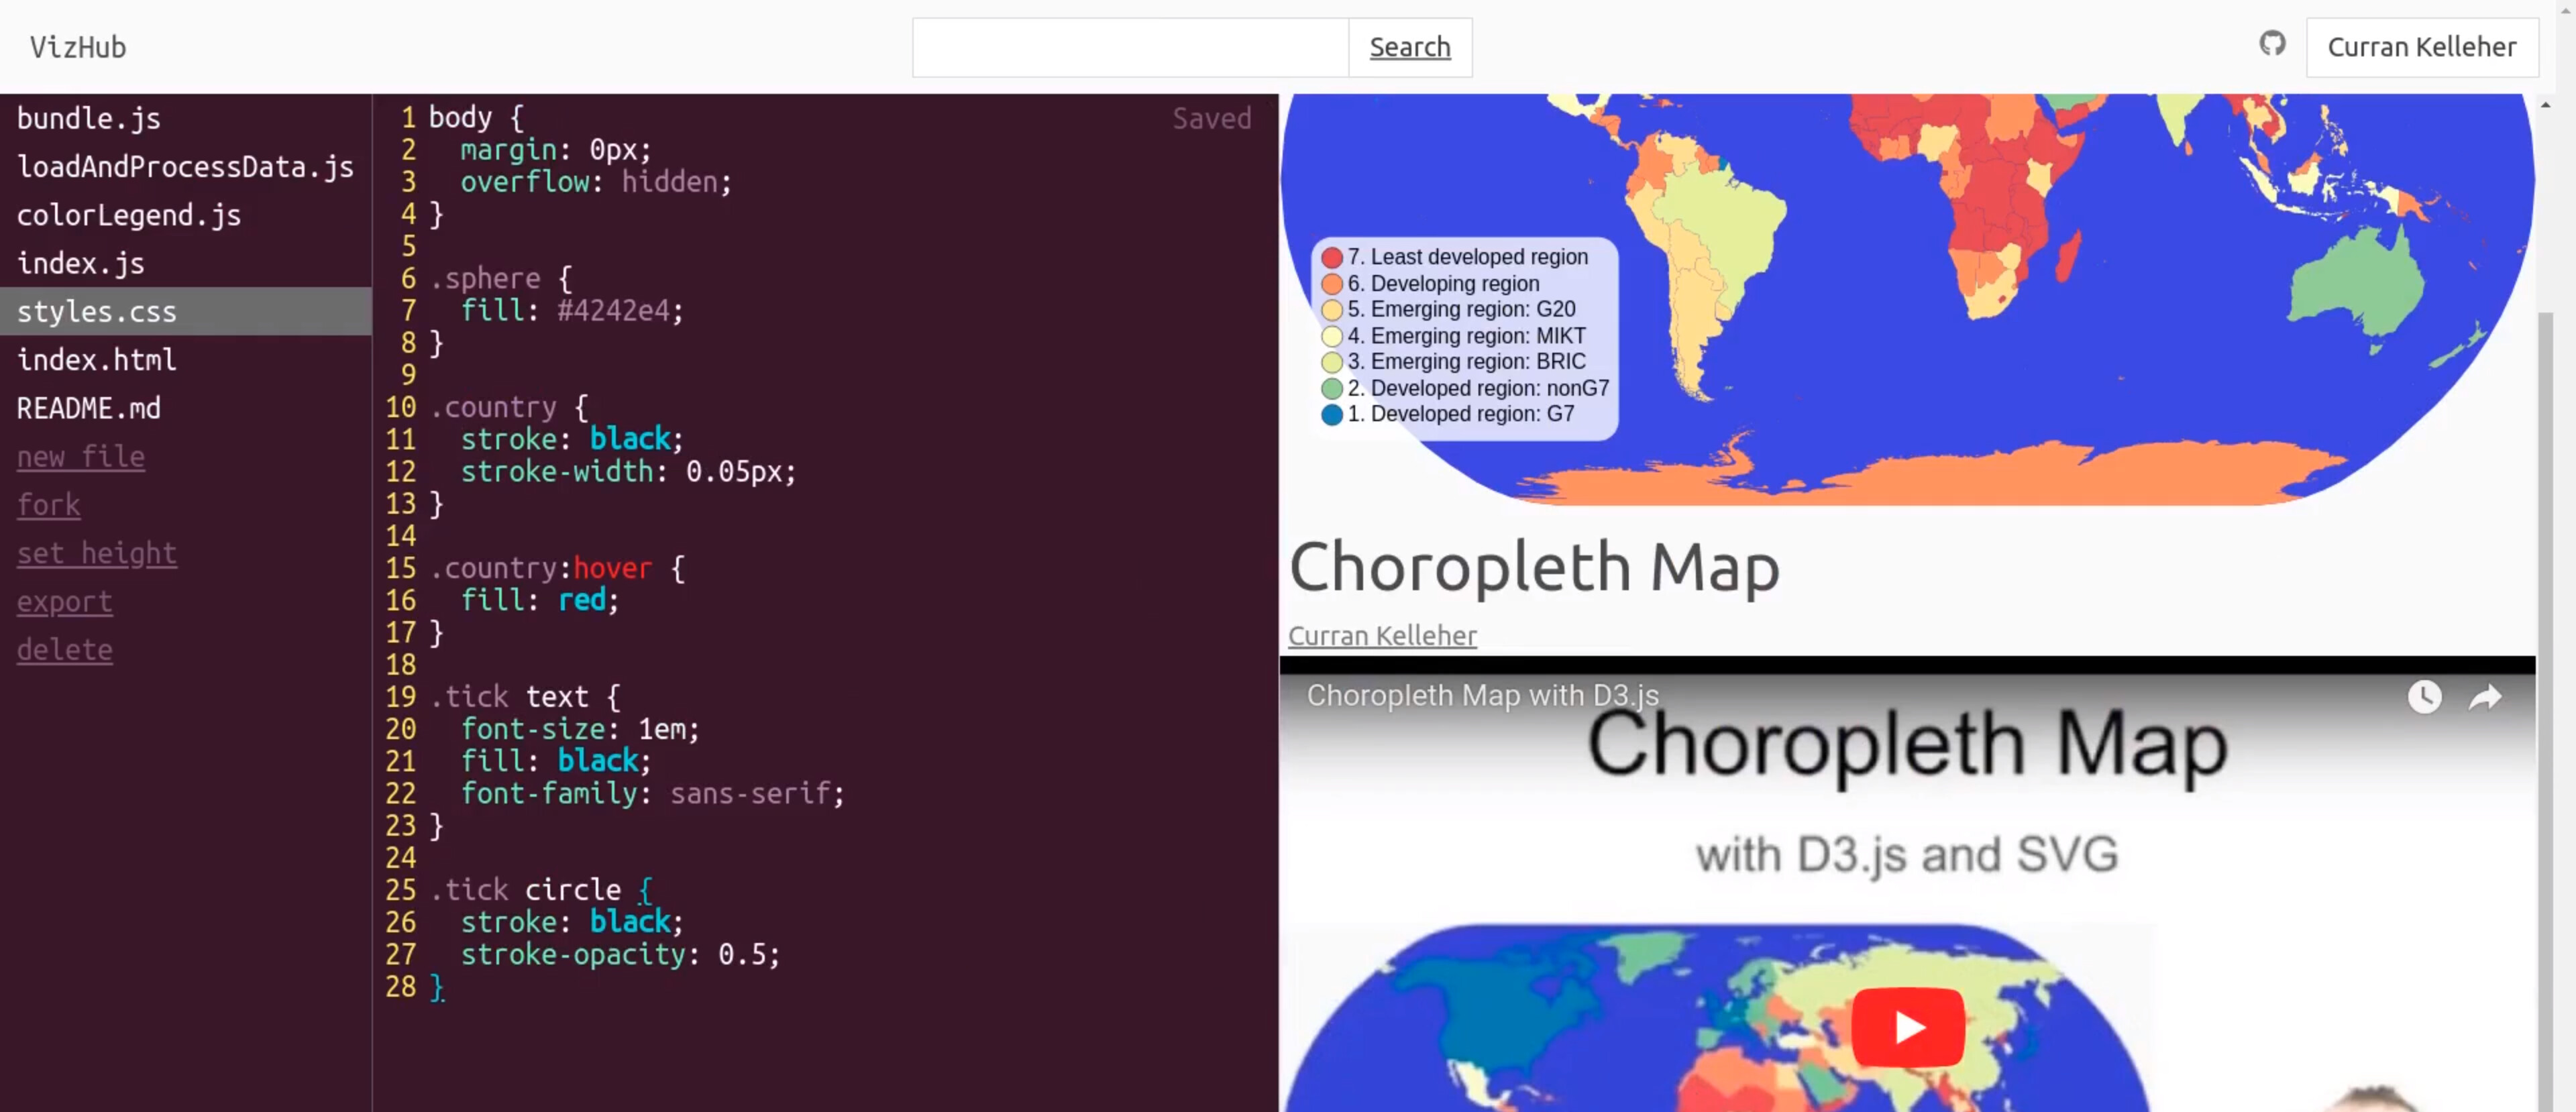
VizHub 1.0 Circa 2018
It then occurred to me that VizHub could be a self-sustaining business. That’s when I hired Stamen Design, a design/dataviz/mapping firm in San Francisco that I had been doing remote consulting work with for several years, to redesign the VizHub product. That redesign work fed into the implementation of VizHub 2.0 in 2019 and launch of the first paid plan in 2020.
I’m currently a Design Technologist at Stamen Design, and VizHub is my side project.
I hope that this virtual space around VizHub can become a blossoming community, much like the D3 community of the 2015 era, where people come together to share their work and ideas, discuss things, and generally share experiences of the joy of creating cool things with technology.
8 Likes
Hi!
My name is Valentine and I am a freelance journalist from Vienna focusing on socio-political and digitalization topics. I started the Datavis 2020 course a few months ago, but I don’t have as much time for it as I would like. So I’m still quite at the beginning - also because I don’t have any knowledge of programming otherwise.
However, I’ve been working with data visualizations for a while now, but I’ve always used different online tools so far. The limitations of these tools were the reason why I started with D3. It will take some time until I can actually sell self-written graphics, but I’m working on it 
5 Likes
Welcome @ValentineAuer!
I have to say that I’m quite impressed with your work in terms of application of consistent visual branding. In particular these:
You have a good eye for design and these really turned out great!
4 Likes
Oh! Thank you so much 

Tell us when you do. I’d love to hear more about data viz being (partially or fully) a career path!
And I agree with Curran… I’ve been following your work, and I really like your visualizations and their unified theming. Keep going! 
3 Likes
Hi! My name is Andre and I’m just happy to be here. Currently I am enrolled in the Data Analytics program at Golden Gate University and I love learning. My coding experience is limited, and Curran’s introduction to Vizhub was a godsend. Dataviz 2020 has been a blast!
5 Likes
Thank you so much. I am also following your work and yeah, sometimes I am “stealing” your ideas for my vizualisations 
2 Likes
Hello! I’m a former journalist making a pivot into front-end-development. Over the past two years, I’ve finished four 300-hour certifications on FreeCodeCamp. I found Vizhub on Curran’s 13-hour course on YouTube, and it’s been really helpful to me as I have been able to follow and fork examples here and repurpose them with datasets I wanted to explore. My long term objective is to acquire the skills needed to pull off data journalism projects that are as insightful and playful as Pudding.cool. (Not sure if it will pay the bills, but it interests me a lot)
As I reflect on the year gone by, I am grateful for Vizhub’s existence and Curran’s passion for teaching this skill. I don’t think I could have pulled off this viz without Vizhub!
https://vizhub.com/sriramvsharma/ca65c4ad2c9b41b595af5146d9591af4
7 Likes
If you put the VizHub link on its own line in this forum, it will unfurl:
Very nice!
2 Likes
Hello :), I’m a phd candidate applying machine learning on medical images. I really like doing visualizations and Curran videos has really pushed me to learn JS and d3 :).
8 Likes
I am a full stack developer learning to build React application with D3 library as it has use for various modules in the project that I am currently working for a startup prototype. Have worked in Mechanical Engg field for 20 years before taking up web development since last 2+ years.
1 Like
I am Shashi, I am an Engineer currently working mainly with Java based technologies, I found your course on freecodecamp channel and I have been following the React and D3 lecture since then, I am really a beginner with Javascript and your tutorial has been really great and the course work along with exercises are very helpful. Cheers.
2 Likes
Hello there! I am Ylber, born and raised in Kumanovo, Macedonia (now North Macedonia). My speciality is Web Development, have been working with web technologies since primary school. Currently I work as a senior (remote) web developer in Switzerland.
Very nice! Welcome to this online community! Happy that you are here.
Any feedback or suggestions for improvement on my courses or VizHub itself is warmly welcome. Always looking to improve.