Hello and welcome! Yeah the SVG mask maybe was a bit too complex a concept to introduce so early in that course. Thanks for the feedback!
Thank you so much for all yor time and effort , the course is amazing and full of useful informations , i really appreciate all the hard work you’re doing to give all of a us a chance to learn .
I am glad I found this course, I find it well done and excellently explained. I still have some JS concepts to learn, and then I get all into 3d!!! Thank you!
Hello! I am Toly from California. I work in cybersecurity and am getting my MS in Data Science from GeorgiaTech.
I have a D3-heavy class and zero experience in D3 and JS. Thus, my goal is to get D3/JS-101 before the class
Awesome! Welcome.
I’m curious, which class is it that uses D3? Is it part of a data science program or something?
I hope the various resources here will be useful to you!
See also Index of Courses
Merry Christmas, Curran! Thank you for dropping a note!
CSE6242 is one of the advanced core classes for an MS Data Science program at Georgia Tech. Here is the li k to the syllabus: https://poloclub.github.io/cse6242-2022spring-online/
It is called Data Visualization and uses D3 heavily. In addition, it throws at students a bag of other technologies such as Pig, Hive, SQLite, JS, Spark, and Hbase.
My problem is that, except for Python and R, I have zero experience in JS, D3, etc. So I am trying to get some basics at least.
There are four homeworks and a team project in this class. No exams. But the HWs are very extensive. So I am very concerned.
My focus is D3 (based on the review of the former students). However, I also need to get some HTML and JS basics.
I started going through your 2022 course. It will be beneficial!
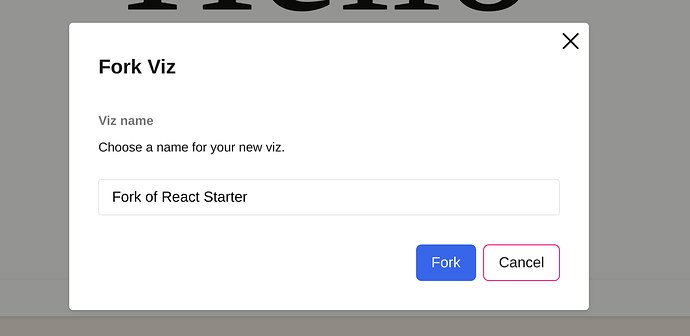
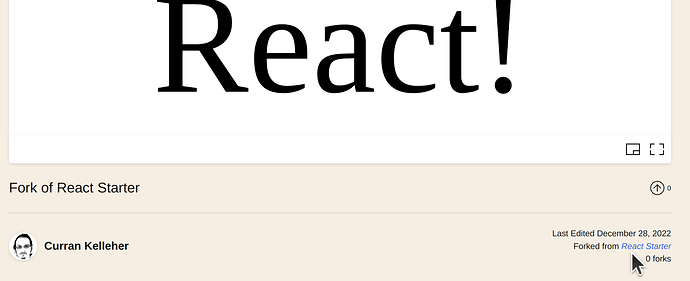
One question about the Viz environment: when I fork an existing index file and rename it, where can I find the file with the old name? There is no SAVE option, so I need clarification.
I intend to use these templates in my HWs.
Thank you!
Toly
Curran, can you share the final code for Sol Lewitt? I followed but do not have the image. I want to compare your code with mine.
Thank you
Oh nice! Looks like his course playlist is on YouTube, which is sweet. Lots of stuff there in addition to visualization wow.
I think this is the final code for Sol LeWitt:
First let me make sure I understand what you’re saying:
- When you say “fork an existing index file”, I think that means that you fork the viz by clicking on the Fork icon and clicking through the dialog.
- After you have forked a viz, that viz shows you which one it was forked from right below the running program on the right side, like this:
Does that answer your question?
yes it does! Thanks!
One more question. can you recommend a good episode where you explain ingestion of the data from the website into D3?
Curran, as an absolute novice to JS and D3, I am struggling even with some simple subjects(((
The colors.
I saw your file for reusable scatter plots with different symbols per specie (iris dataset). I want also to incorporate the colors.
-
.colorValue((d) => d.species) - index.js (within svg.call block) - in the scatterplot.js: here I have difficulties
I understand I need incorporate “color” somehow
export const scatterPlot = () => {
let width;
let height;
let data;
let xValue;
let yValue;
let symbolValue;
let margin;
let color;
let size;
Then
const colorScale = scaleOrdinal()
  .domain(data.map(color))
  .range(???????);
I am doing something wrong, I am sure
please, direct me
This might be a good one for that Loading and Parsing CSV Data.
This might be a good one for that: Scatter Plot with Color
These links have lecture videos embedded. Enjoy!
I am a Front-end developer learning D3.
Hi everyone,
My name is Junaid and I’m Infographic Lead at M&G based in London, and I recently moved here so I’m also looking for social circle to connect with amazing people.
I’m working on data visualization and infographics for quite some time but mostly I used Flourish, RAWGraphs and Adobe Illustrator but now I’ve decided to explore D3. I’ve no coding background but recently picked some courses on html and css and ready to jump on the D3 and picked up @curran’s Youtube course which is amazing, thanks Curran for all the help!
Please feel free to check my LinkedIn and connect if you like, you’ll find some of my infographics there 
https://www.linkedin.com/in/junaidr/
Many thanks,
Junaid
HI,
My name is Najam and I am a student of data viz. I work a lot with data but often have difficulty communicating insights with others!
I do feel frustrated that others do not get what the data is showing but I realize maybe I need to present the data in a more understandable way.
Lets get started!
:))
Justin, I’ve been a welder/fabricator/inspector for the last 15 years. I’m pivoting into a new role working with some colleagues in a climate tech start-up, a lot of it apparently will be in data analysis and data visualization. I started trying to learn to program via internet tutorial a couple years ago and it’s been very slow/sporadic. I am at a point now where I want to move as hard in this direction as possible and not look back.
Hello everyone, I’m mark from Nigeria. I’m hoping to learn how to create and customize existing data visualization libraries.
Glad to be here!
Welcome! I’m glad you are here.
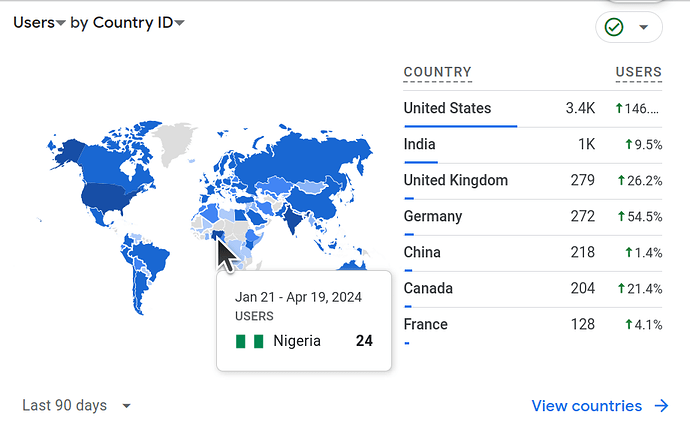
From what I can see in Google Analytics, there are 24 others also in Nigeria who are using VizHub. Perhaps you could connect with them! I’m not sure who they are, but maybe someone using it for a course? Not sure.
Anyway, welcome to VizHub! I hope it’s useful for you. Please do post here if you have any problems with it.
Hello! I am an archaeologist and a university prof and I am trying to develop a software application for archaeologists in the field. I am not a developer but I want to be able to build things myself to better communicate with my developer team mates.
I am completely new to JS and data visualization generally. I found your course Get It Right in Black and White and have been doing my best to follow along and try some of the projects as well. It’s slow-going but I am moving much faster than I h=ever have before, and I am really proud of myself for what I have already made just while following along!
Not much to show yet, but hopefully soon I will make some awesome visuals to show off.
Thank you!


